Description
Powell Miscellaneous Functions for Teaching and Learning Statistics.
Description
Miscellaneous functions useful for teaching statistics as well as actually practicing the art. They typically are not new methods but rather wrappers around either base R or other packages.
README.md

Overview
A package that includes functions that I find useful for teaching statistics as well as actually practicing the art. They typically are not “new” methods but rather wrappers around either base R or tidyverse packages. Currently contains the following major user oriented functions:
Plot2WayANOVAwhich as the name implies conducts a 2 way ANOVA and plots the results usingggplot2PlotXTabs2which wraps aroundggplot2to provide Bivariate bar charts for categorical and ordinal data.newggslopegraphwhich creates a Tufte“esque” slopegraph usingggplot2chaid_tableprovides tabular summary ofCHAIDpartykitobjectcross2_var_vectorsa helper function to build lists of “crossed” variablesSeeDistwhich wraps aroundggplot2to provide visualizations of univariate data.OurConfis a simulation function that helps you learn about confidence intervals
Installation
# Install from CRAN
install.packages("CGPfunctions")

# Or the development version from GitHub
# install.packages("devtools")
devtools::install_github("ibecav/CGPfunctions",
                         build_vignettes = TRUE,
                         upgrade = "ask")
Usage
Online documentation and vignettes are located here.
Example Plot2WayANOVA plot
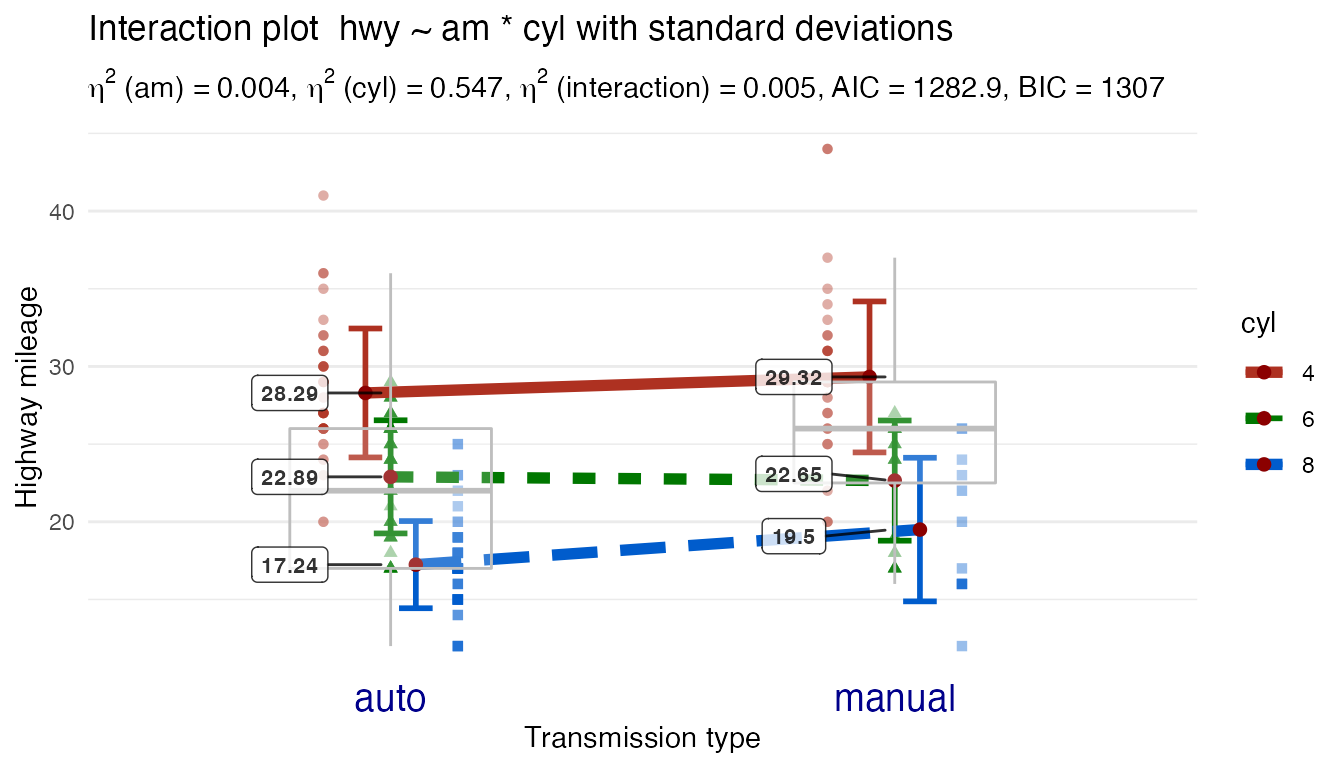
Example Plot2WayANOVA
Example PlotXTabs2 plot
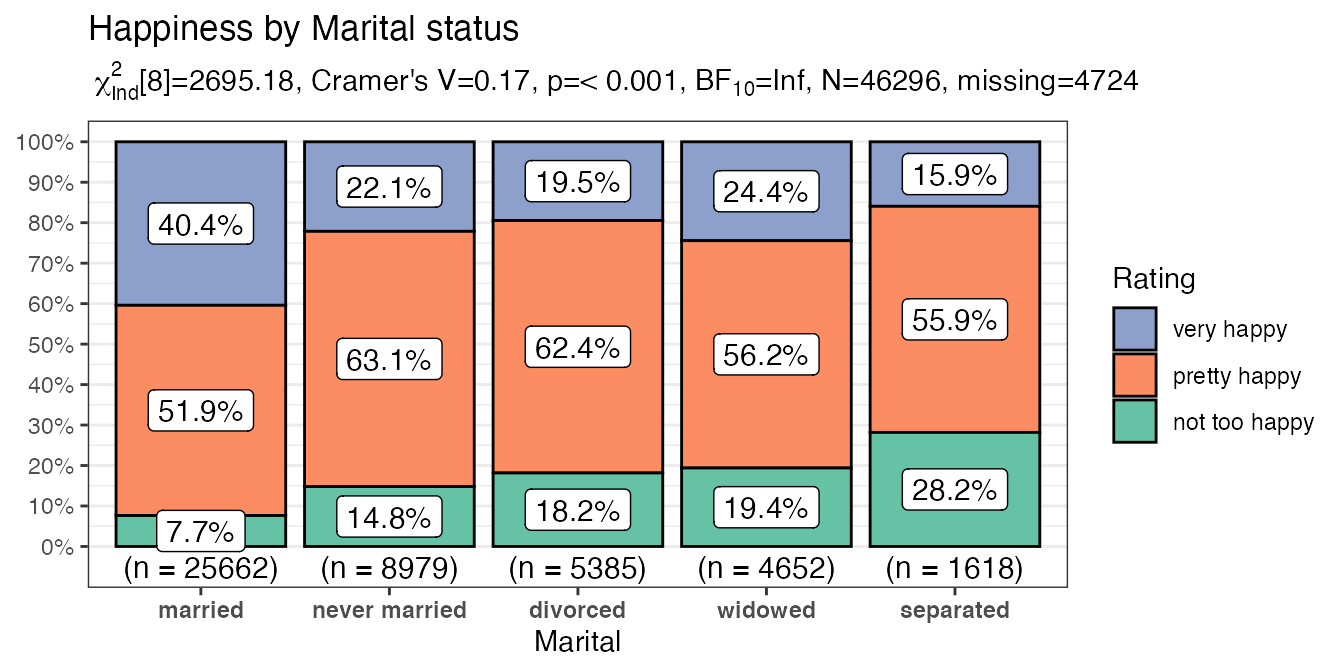
Example PlotXTabs2 plot
Example newggslopegraph plot
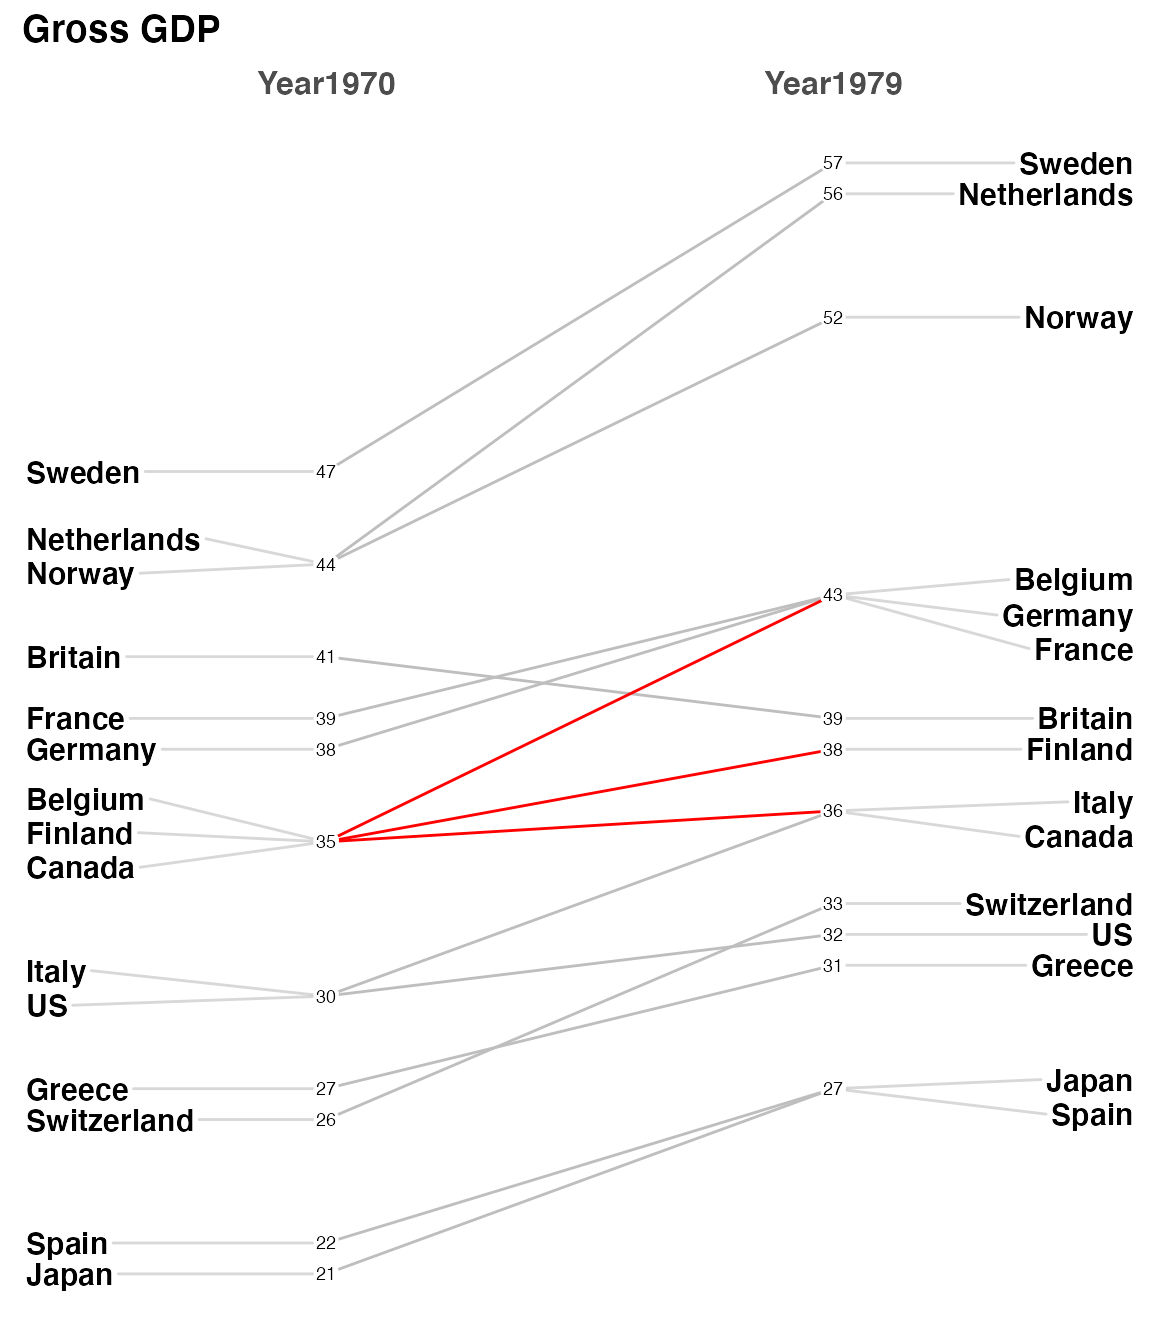
Example newggslopegraph plot
Credits
Many thanks to Danielle Navarro and the book Learning Statistics with R.
Leaving Feedback
If you like CGPfunctions, please consider leaving feedback here.
Contributing
Contributions in the form of feedback, comments, code, and bug reports are most welcome. How to contribute:
- Issues, bug reports, and wish lists: File a GitHub issue.
- Contact the maintainer ibecav at gmail.com by email.