Access to the 'CEPALSTAT API'.
CepalStatR
![]()
![]()
![]()
R interface to access, explore and visualize CEPALSTAT indicators
CEPALSTAT Portal · Paper (LACCEI 2024) · Report Issue
Overview
CepalStatR is an R package that provides a reproducible and user-friendly interface to access data and metadata from CEPALSTAT, the statistical portal of the Economic Commission for Latin America and the Caribbean (ECLAC/CEPAL).
The package is designed to simplify the interaction with the CEPALSTAT API, allowing users to:
- explore the hierarchical structure of indicators,
- download data in tidy formats,
- and generate both static and interactive visualizations.
It is particularly useful for researchers, analysts, and students working with Latin American and Caribbean statistics.
Main Features
- Access CEPALSTAT indicators directly from R
- Retrieve metadata and hierarchical structures
- Download indicator data in tidy format
- List countries available in CEPALSTAT
- Generate demographic visualizations (population pyramids)
- Create SDG indicator rankings
- Explore indicators via interactive tables and thematic maps
Installation
Install the development version from GitHub:
# install.packages("devtools")
devtools::install_github("Henry-Osorto/CepalStatR")
Quick start
library(CepalStatR)

# Interactive indicator browser
viewer.indicators()

# Download the indicator hierarchy as a data frame
indicators <- call.indicators()

# Download indicator data
df <- call.data(id.indicator = 1)

# Available countries
countries()

# Population pyramids
pyramids(country = "Honduras", years = c(1, 5, 10, 15))

# SDG ranking
ranking.sdg(id.indicator = 3682)

# Interactive thematic map
topic_map()
Core functions
Metadata and exploration
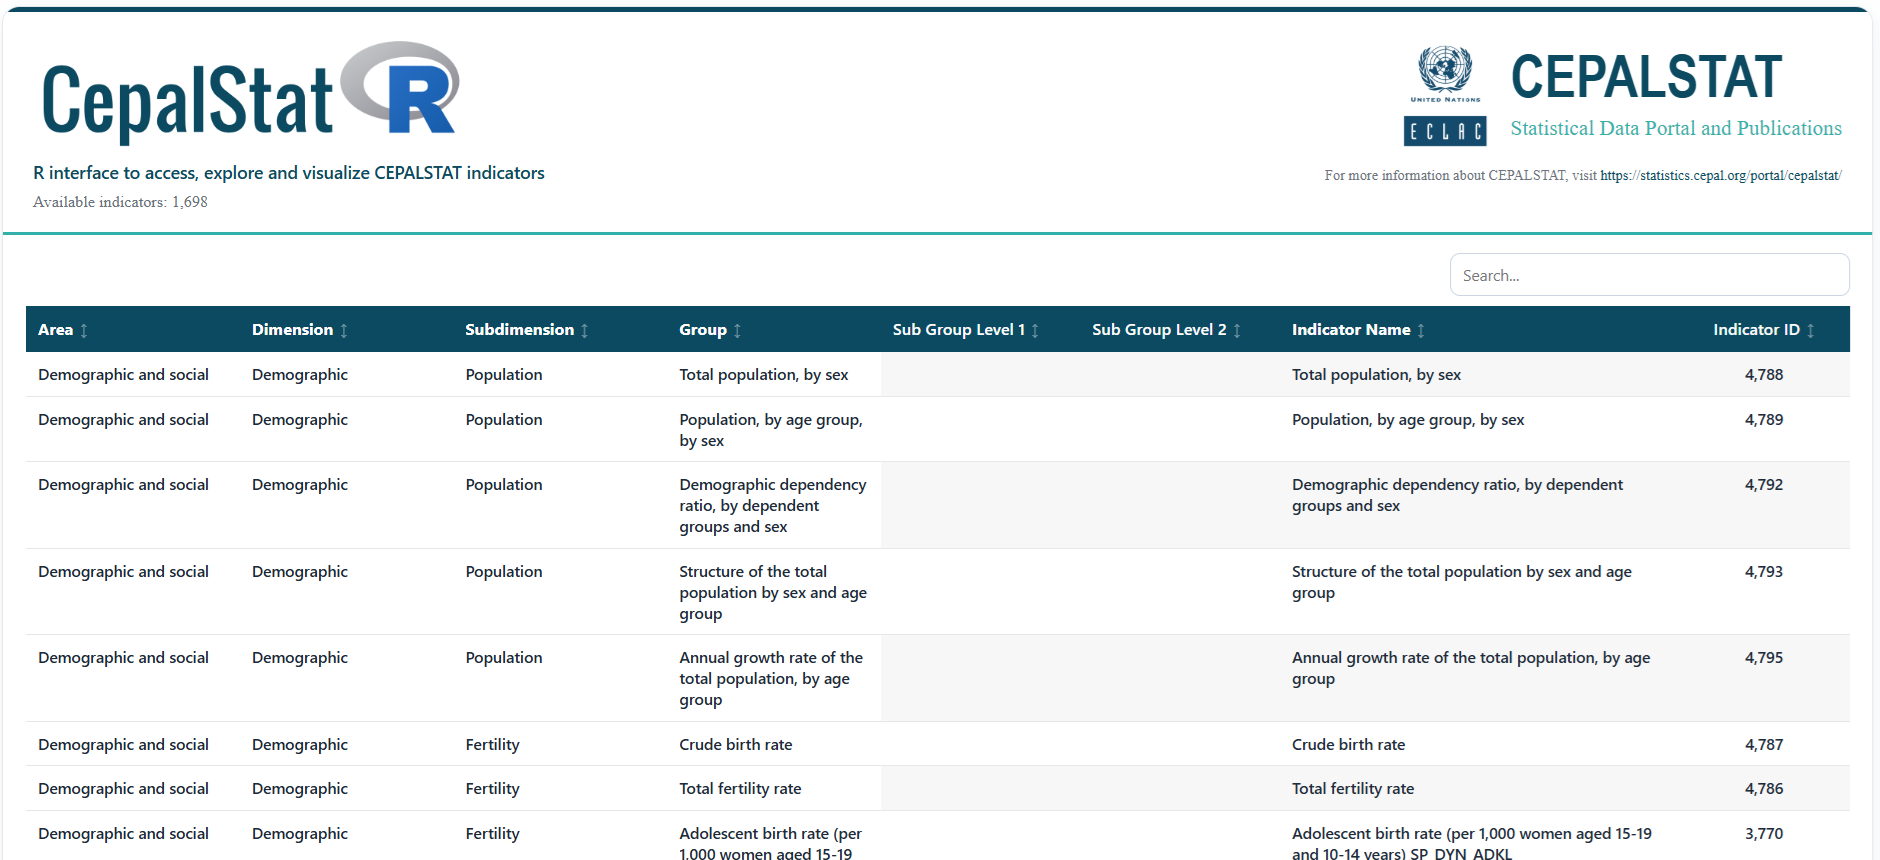
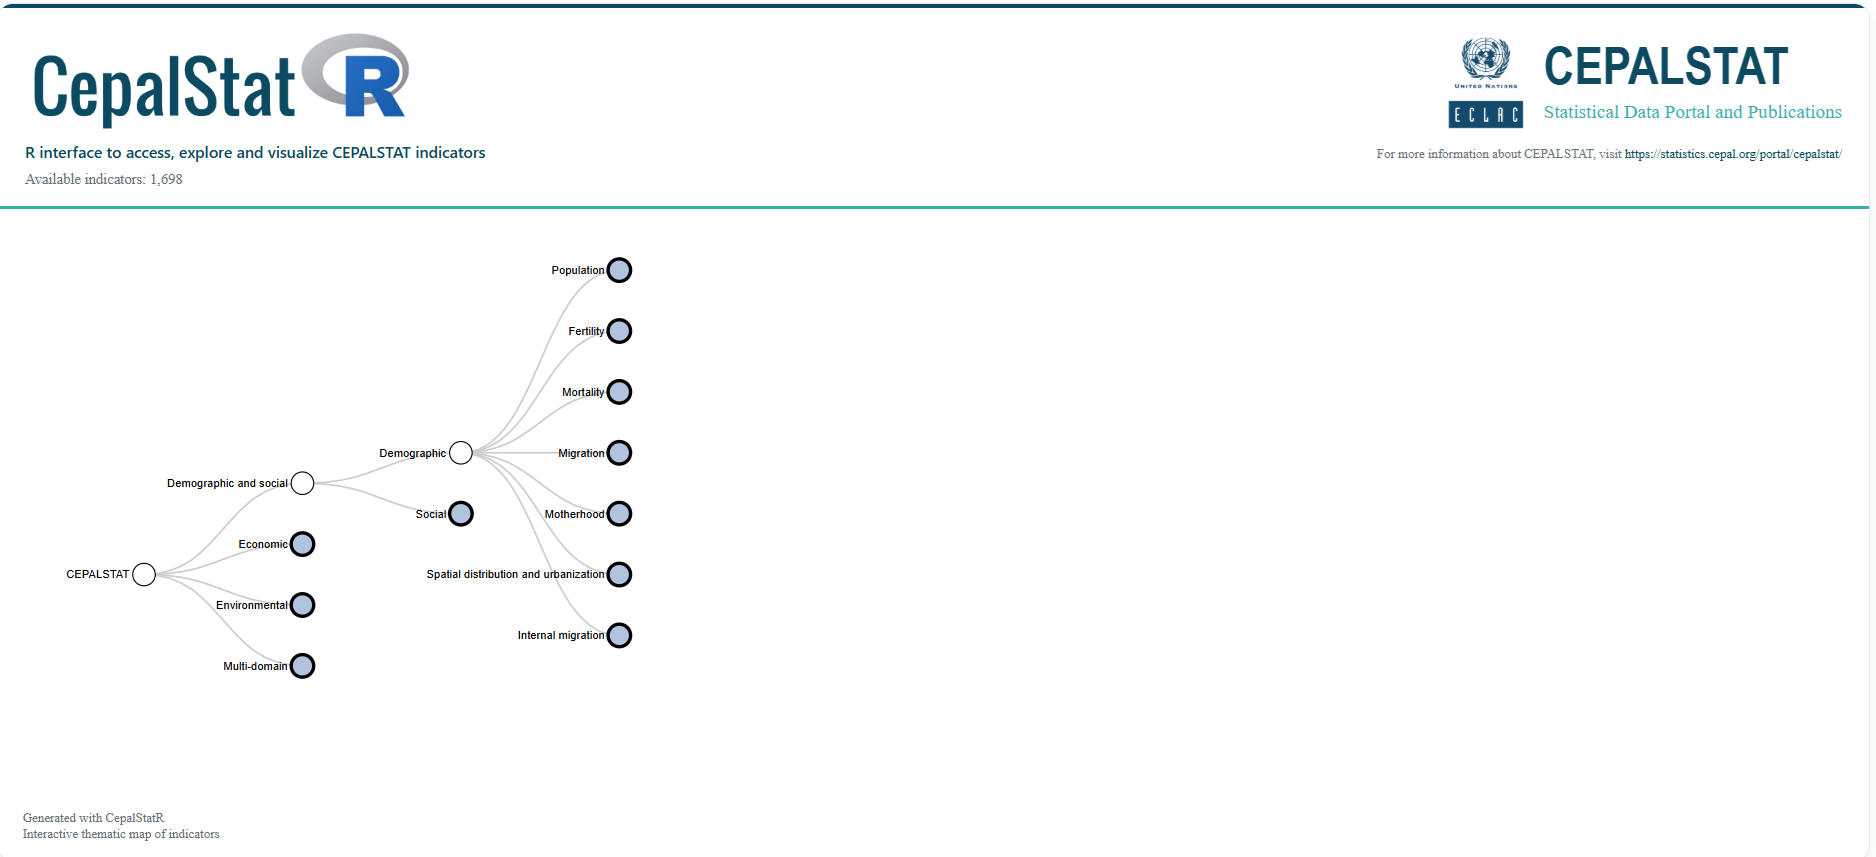
call.indicators()— downloads the thematic structure of CEPALSTAT indicatorsviewer.indicators()— displays the indicator hierarchy in an interactive HTML tabletopic_map()— creates an interactive thematic tree of indicatorscountries()— returns the list of available countries from CEPALSTAT dimensions
Data retrieval
call.data()— downloads indicator data and returns an analysis-ready data frame
Visualization
pyramids()— generates population pyramids using CEPALSTAT demographic indicatorsranking.sdg()— creates ranking plots for indicators associated with the Sustainable Development Goals
Screenshots
Interactive indicator viewer
Interactive thematic map
Data source
All data and metadata are obtained from CEPALSTAT:
https://statistics.cepal.org/portal/cepalstat/
Why use CepalStatR?
CEPALSTAT provides a rich statistical infrastructure for Latin America and the Caribbean, but direct use of its API may be cumbersome for many users. CepalStatR simplifies that process by offering a consistent R interface for metadata discovery, reproducible data acquisition, tidy outputs, and built-in visual tools for exploratory and applied analysis.
This makes the package especially suitable for:
- empirical research
- policy analysis
- reproducible workflows
- academic teaching
- exploratory analysis of regional statistics
Citation
If you use CepalStatR in academic work, please cite the conference paper that documents the package:
Osorto, H. (2024). CepalStatR: a package in R for access to ECLAC statistics. 22nd LACCEI International Multi-Conference for Engineering, Education, and Technology. https://doi.org/10.18687/LACCEI2024.1.1.1473
BibTeX
@inproceedings{Osorto2024CepalStatR,
  author    = {Henry Osorto},
  title     = {CepalStatR: a package in R for access to ECLAC statistics},
  booktitle = {22nd LACCEI International Multi-Conference for Engineering, Education, and Technology},
  year      = {2024},
  doi       = {10.18687/LACCEI2024.1.1.1473}
}
Project status
The package currently includes a CRAN-ready structure, interactive exploration tools, indicator retrieval functions, and built-in visualization features. Future development may extend the package with additional metadata utilities, thematic graphics, and analytical workflows.
Reporting issues
Bug reports, suggestions, and feature requests are welcome through the GitHub issue tracker:
https://github.com/Henry-Osorto/CepalStatR/issues.