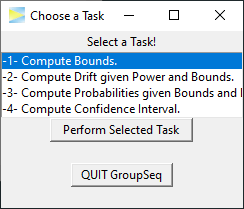
Group Sequential Design Probabilities - With Graphical User Interface.
GroupSeq 
GroupSeq computes probabilities related to group sequential designs for normally distributed test statistics. It enables to derive critical boundaries, power, drift, and confidence intervals of such designs, mostly using the alpha spending approach of DeMets and Lan (1994).
The main motivation for the development of this package was to make this area of statistics freely available for a broad audience, which is one of the reasons why all functionality is provided by a graphical user interface.
Installation
# Install release version from CRAN
install.packages("GroupSeq")

# Install development version from GitHub
devtools::install_github("rpahl/GroupSeq")
Usage
Load the library to start the graphical user interface.
library("GroupSeq")

To get started see the General Introduction page.
Alternative tools
Since the package was written back in 2005, the graphical user interface may appear a bit outdated. Still, it does it’s job and at least has stood the test of time. Luckily in recent years others have started to develop R-based tools with graphical user interface and similar (and more) statistical functionality:
- gsDesign with a free shiny web interface including tutorials.
- rpact also with a free shiny web interface and lots of vignettes.
References
DeMets, D. L., and K. K. Lan. 1994. “Interim analysis: the alpha spending function approach.” Stat Med 13 (13-14): 1341–52. https://doi.org/10.1002/sim.4780131308.
- The package author is considering to work on a second version with more functionality and a revised user interface in the near future. Feel free to request new features here.

