Analysis of Antimicrobial Minimum Inhibitory Concentration Data.
MIC
![]()
Introduction
MIC is an R package for the analysis of minimum inhibitory concentration (MIC) data. The package was designed to be compatible with the AMR, in particular most of the functions in MIC are designed to accept and return AMR objects, such as mic and sir. The primary functions in MIC are designed towards validation studies of minimum inhibitory concentrations, however it also can (optionally) be used to support the construction of machine learning models that predict MIC values from genomic data.
Features
- Validation metrics (such as essential agreement) for MIC experiments or predictions allow comparison against a gold standard, in line with ISO 20776-2:2021.
- Plots and tables can be generated from validation experiments.
- Quality control analysis of MIC experiments.
- Functions to deal with censoring in MIC data.
- Helper functions to download whole genome sequencing data and susceptibility metadata from the PATRIC database at BV-BRC.
- Conversion of whole genome sequence data (assembled .fna files) to k-mer based features for machine learning models.
- Fast k-mer counting using C++ and
Rcpp. - K-mer features stored in
XGBoost-compatiblelibsvmformat.
Installation
CRAN
install.packages("MIC")
GitHub
# install.packages("remotes")
remotes::install_github("agerada/MIC")
Example
Load the MIC package – it is highly recommended that AMR is also loaded. Where possible, MIC functions maintain compatibility with AMR objects, in particular the mic and sir classes.
library(MIC)
#>
#> Attaching package: 'MIC'
#> The following object is masked from 'package:base':
#>
#>     table
library(AMR)
To compare two mic vectors (e.g., one from a gold standard and one from a prediction or investigational assay), the compare_mic function can be used. An example dataset of MIC values is provided with the package, which will be used here.
data("example_mics")
head(example_mics)
#>      gs  test           mo  ab
#> 1 0.002 0.002 B_ESCHR_COLI GEN
#> 2 0.004 0.002 B_ESCHR_COLI GEN
#> 3     8    16 B_ESCHR_COLI GEN
#> 4 0.008 0.016 B_ESCHR_COLI GEN
#> 5    64    64 B_ESCHR_COLI GEN
#> 6  0.06  0.06 B_ESCHR_COLI GEN
The dataset contains MIC values (in mic format) for a “test” assay, and a “gold standard” (gs) assay. We will use compare_mic to compare the MICs and validate the “test” assay:
val <- compare_mic(gold_standard = example_mics$gs, test = example_mics$test)
val
#> MIC validation object with 300 observations
#> Agreement type: essential
Calling summary provides the essential agreement (EA) rates and assay bias:
summary(val)
#> MIC validation summary
#> Essential agreement: 267 (89%)
#> Bias: -7
If organisms and antimicrobials are provided, compare_mic will also calculate and return the categorical agreement (CA) rates, in the form of minor, major, and very major errors:
val <- compare_mic(gold_standard = example_mics$gs, test = example_mics$test,
                   mo = example_mics$mo, ab = example_mics$ab)
val
#> MIC validation object with 300 observations
#> Agreement type: essential and categorical
#> Antibiotics: GEN, MEM, AMX
#> Organisms: B_ESCHR_COLI
This time, calling summary will provide a breakdown of the categorical agreement rates in addition to the EA rates:
summary(val)
#> MIC validation summary
#> Antibiotic: AMX, GEN, MEM
#> Organism: B_ESCHR_COLI
#> Essential agreement: 267 (89%)
#> Resistant: 113 (37.67%)
#> Minor errors: 0 (0%)
#> Major errors: 6 (2%)
#> Very major errors: 8 (2.67%)
#> Mean bias: -7
#> N: 300
#> *Use as.data.frame() to see full summary*
Using as.data.frame allows us to continue working with the summarised results:
head(as.data.frame(val))
#>   gold_standard  test essential_agreement  ab           mo gold_standard_sir
#> 1         0.002 0.002                TRUE GEN B_ESCHR_COLI                 S
#> 2         0.004 0.002                TRUE GEN B_ESCHR_COLI                 S
#> 3             8    16                TRUE GEN B_ESCHR_COLI                 R
#> 4         0.008 0.016                TRUE GEN B_ESCHR_COLI                 S
#> 5            64    64                TRUE GEN B_ESCHR_COLI                 R
#> 6          0.06  0.06                TRUE GEN B_ESCHR_COLI                 S
#>   test_sir error
#> 1        S  <NA>
#> 2        S  <NA>
#> 3        R  <NA>
#> 4        S  <NA>
#> 5        R  <NA>
#> 6        S  <NA>
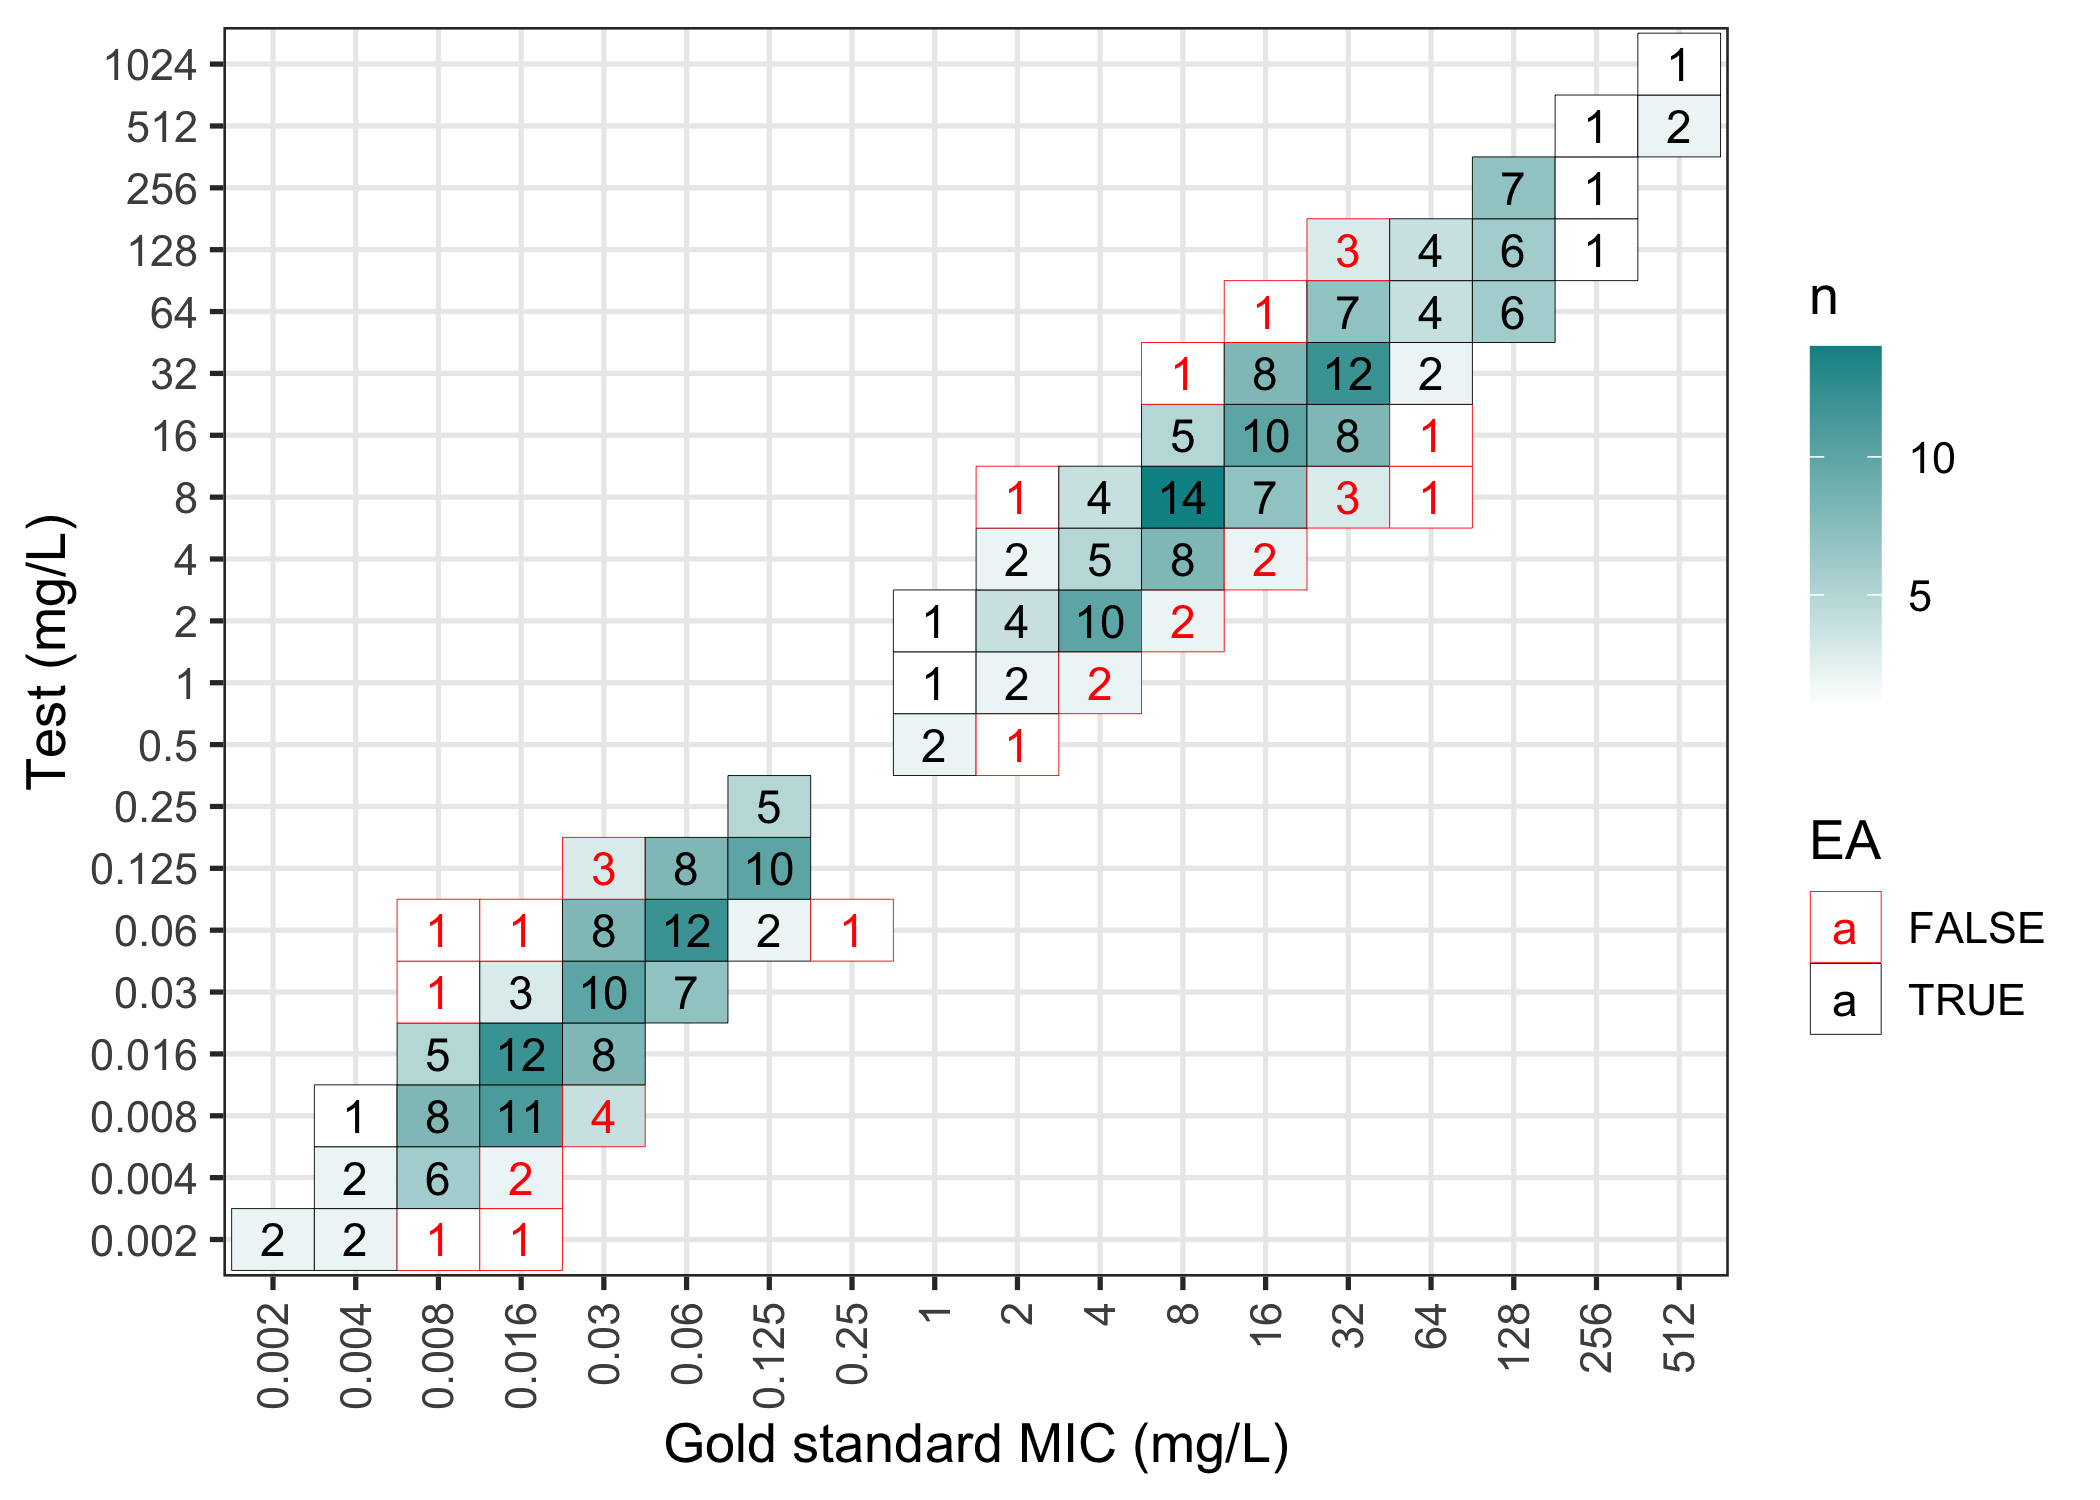
The results of an mic_validation can be plotted in a confusion matrix (failed essential agreements are in red):
plot(val)
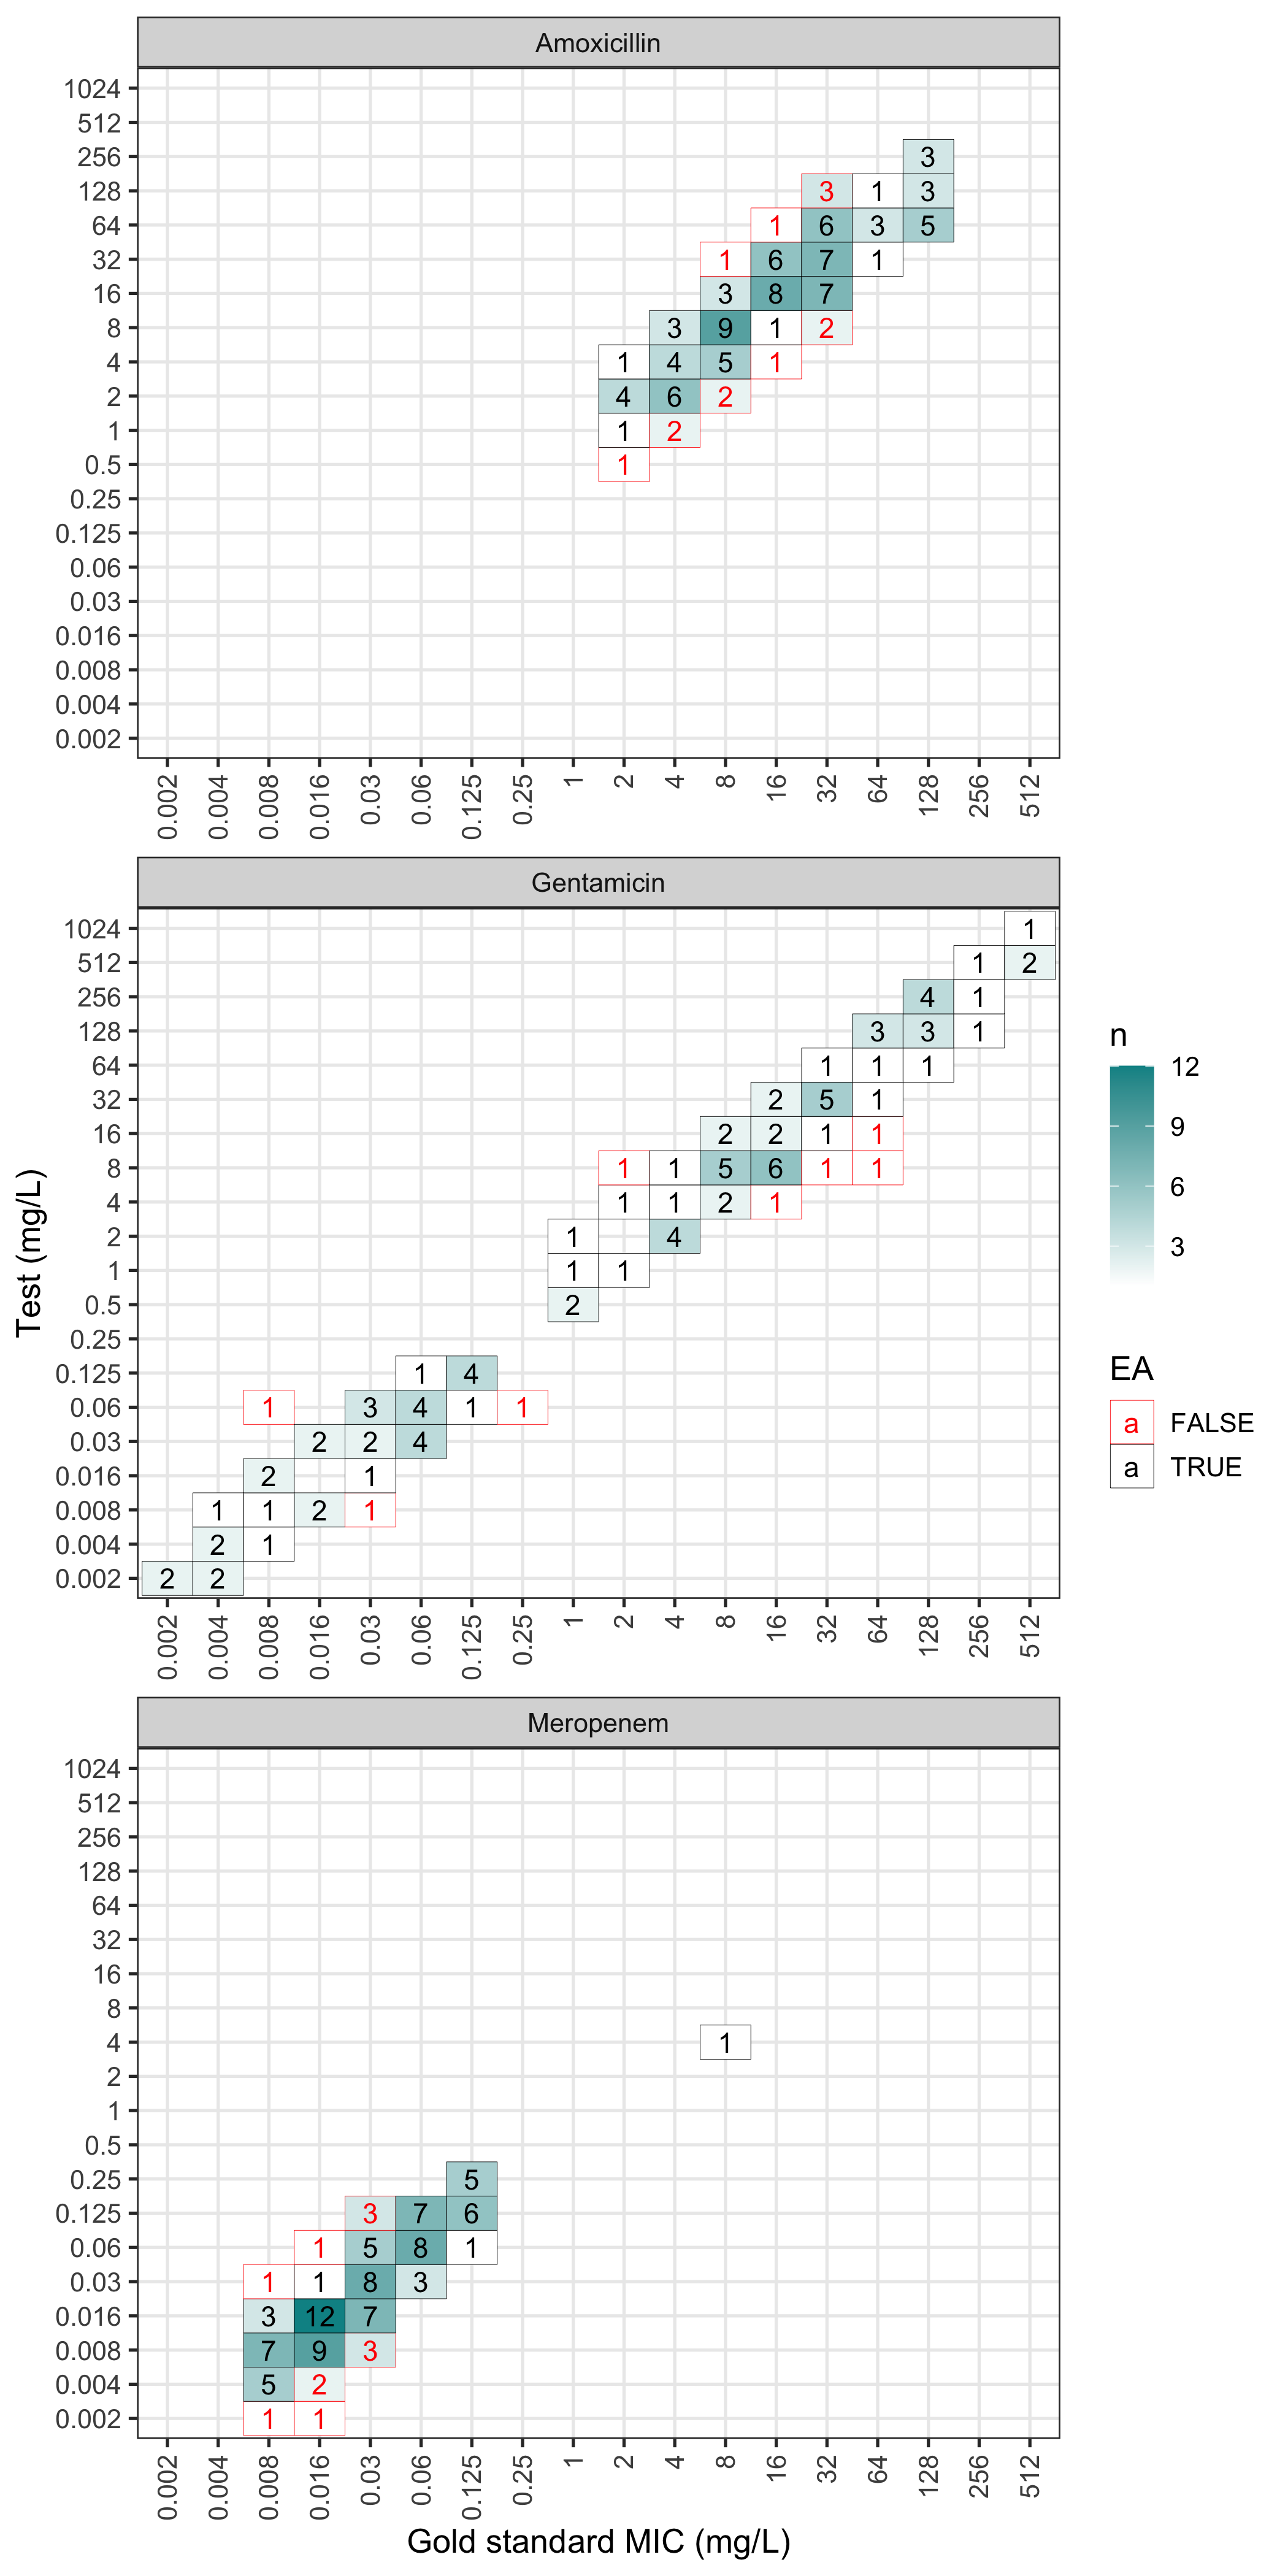
The plot can also be faceted by antimicrobial:
plot(val, facet_wrap_ncol = 1)
The table function can be used to generate a table of the results:
# generate table for MEM
mem_dat <- subset(example_mics, ab == "MEM")
mem_val <- compare_mic(gold_standard = mem_dat$gs, test = mem_dat$test)
table(mem_val)
