Diagnostics for Lists of Codes Based on Measurements.
MeasurementDiagnostics 
![]()
![]()
![]()
The MeasurementDiagnostics package provides tools to assess how measurements are recorded and used in data mapped to the OMOP Common Data Model.
Diagnostics can be run either on the full dataset or restricted to a specific cohort, helping users better understand data completeness, frequency, and value distributions for measurements of interest.
Installation
The package can be installed from CRAN:
install.packages("MeasurementDiagnostics")
Or you can install the development version of the package from GitHub:
# install.packages("devtools")
devtools::install_github("ohdsi/MeasurementDiagnostics")
Example
Suppose you are conducting a study that relies on measurements of respiratory function. Before using these measurements analytically, you may want to understand how frequently they are recorded, how values are stored, and whether they vary across subgroups. MeasurementDiagnostics can be used to explore these aspects.
For this example we’ll use the GiBleed mock data.
library(omock)
library(MeasurementDiagnostics)
library(OmopViewer)
library(omopgenerics)
cdm <- mockCdmFromDataset(datasetName = "GiBleed")
#> ℹ Reading GiBleed tables.
#> ℹ Adding drug_strength table.
#> ℹ Creating local <cdm_reference> object.
cdm
#>
#> ── # OMOP CDM reference (local) of GiBleed ─────────────────────────────────────
#> • omop tables: care_site, cdm_source, concept, concept_ancestor, concept_class,
#> concept_relationship, concept_synonym, condition_era, condition_occurrence,
#> cost, death, device_exposure, domain, dose_era, drug_era, drug_exposure,
#> drug_strength, fact_relationship, location, measurement, metadata, note,
#> note_nlp, observation, observation_period, payer_plan_period, person,
#> procedure_occurrence, provider, relationship, source_to_concept_map, specimen,
#> visit_detail, visit_occurrence, vocabulary
#> • cohort tables: -
#> • achilles tables: -
#> • other tables: -
Now we have a cdm reference with our data, we will create a codelist with measurement concepts.
respiratory_function_codes <- list("respiratory_function" = c(4052083L, 4133840L, 3011505L))
And now we can run all measurement diagnostic checks, stratifying results by sex.
respiratory_function_measurements <- summariseMeasurementUse(
  cdm = cdm, codes = respiratory_function_codes, bySex = TRUE
)
The results include three main components:
A summary of measurement use, including the number of subjects with measurements, the number of measurements per subject, and the time between measurements.
A summary of measurement values recorded as numeric.
A summary of measurement values recorded using concepts.
Visualise results: Tables
Tabular summaries can be produced using the corresponding table functions. For example, the following tables display summaries of numeric values and concept-based values:
tableMeasurementValueAsConcept(
  respiratory_function_measurements,
  hide = c("cdm_name", "domain_id", "value_as_concept_id")
)
| Concept name | Concept ID | Source concept name | Source concept ID | Variable name | Value as concept name | Estimate name | Sex | ||
|---|---|---|---|---|---|---|---|---|---|
| overall | Female | Male | |||||||
| respiratory_function | |||||||||
| overall | overall | overall | overall | measurement_records | No matching concept | N (%) | 8,728 (100.00%) | 4,807 (100.00%) | 3,921 (100.00%) |
| FEV1/FVC | 3011505 | FEV1/FVC | 3011505 | measurement_records | No matching concept | N (%) | 2,320 (100.00%) | 1,374 (100.00%) | 946 (100.00%) |
| Measurement of respiratory function | 4052083 | Measurement of respiratory function | 4052083 | measurement_records | No matching concept | N (%) | 4,088 (100.00%) | 2,059 (100.00%) | 2,029 (100.00%) |
| Spirometry | 4133840 | Spirometry | 4133840 | measurement_records | No matching concept | N (%) | 2,320 (100.00%) | 1,374 (100.00%) | 946 (100.00%) |
respiratory_function_measurements |>
  filterGroup(concept_name == "overall") |>
  tableMeasurementValueAsNumber(
    hide = c(
      "concept_name", "concept_id", "source_concept_name", "source_concept_id",
      "domain_id", "unit_concept_id"
    )
  )
| CDM name | Unit concept name | Variable name | Variable level | Estimate name | Sex | ||
|---|---|---|---|---|---|---|---|
| overall | Female | Male | |||||
| respiratory_function | |||||||
| GiBleed | No matching concept | Measurement records | – | N | 8,728 | 4,807 | 3,921 |
| Value as number | – | Median [Q25 – Q75] | – | – | – | ||
| Q05 – Q95 | – | – | – | ||||
| Q01 – Q99 | – | – | – | ||||
| Range | – | – | – | ||||
| Missing value, N (%) | 8,728 (100.00%) | 4,807 (100.00%) | 3,921 (100.00%) | ||||
Visualise results: Plots
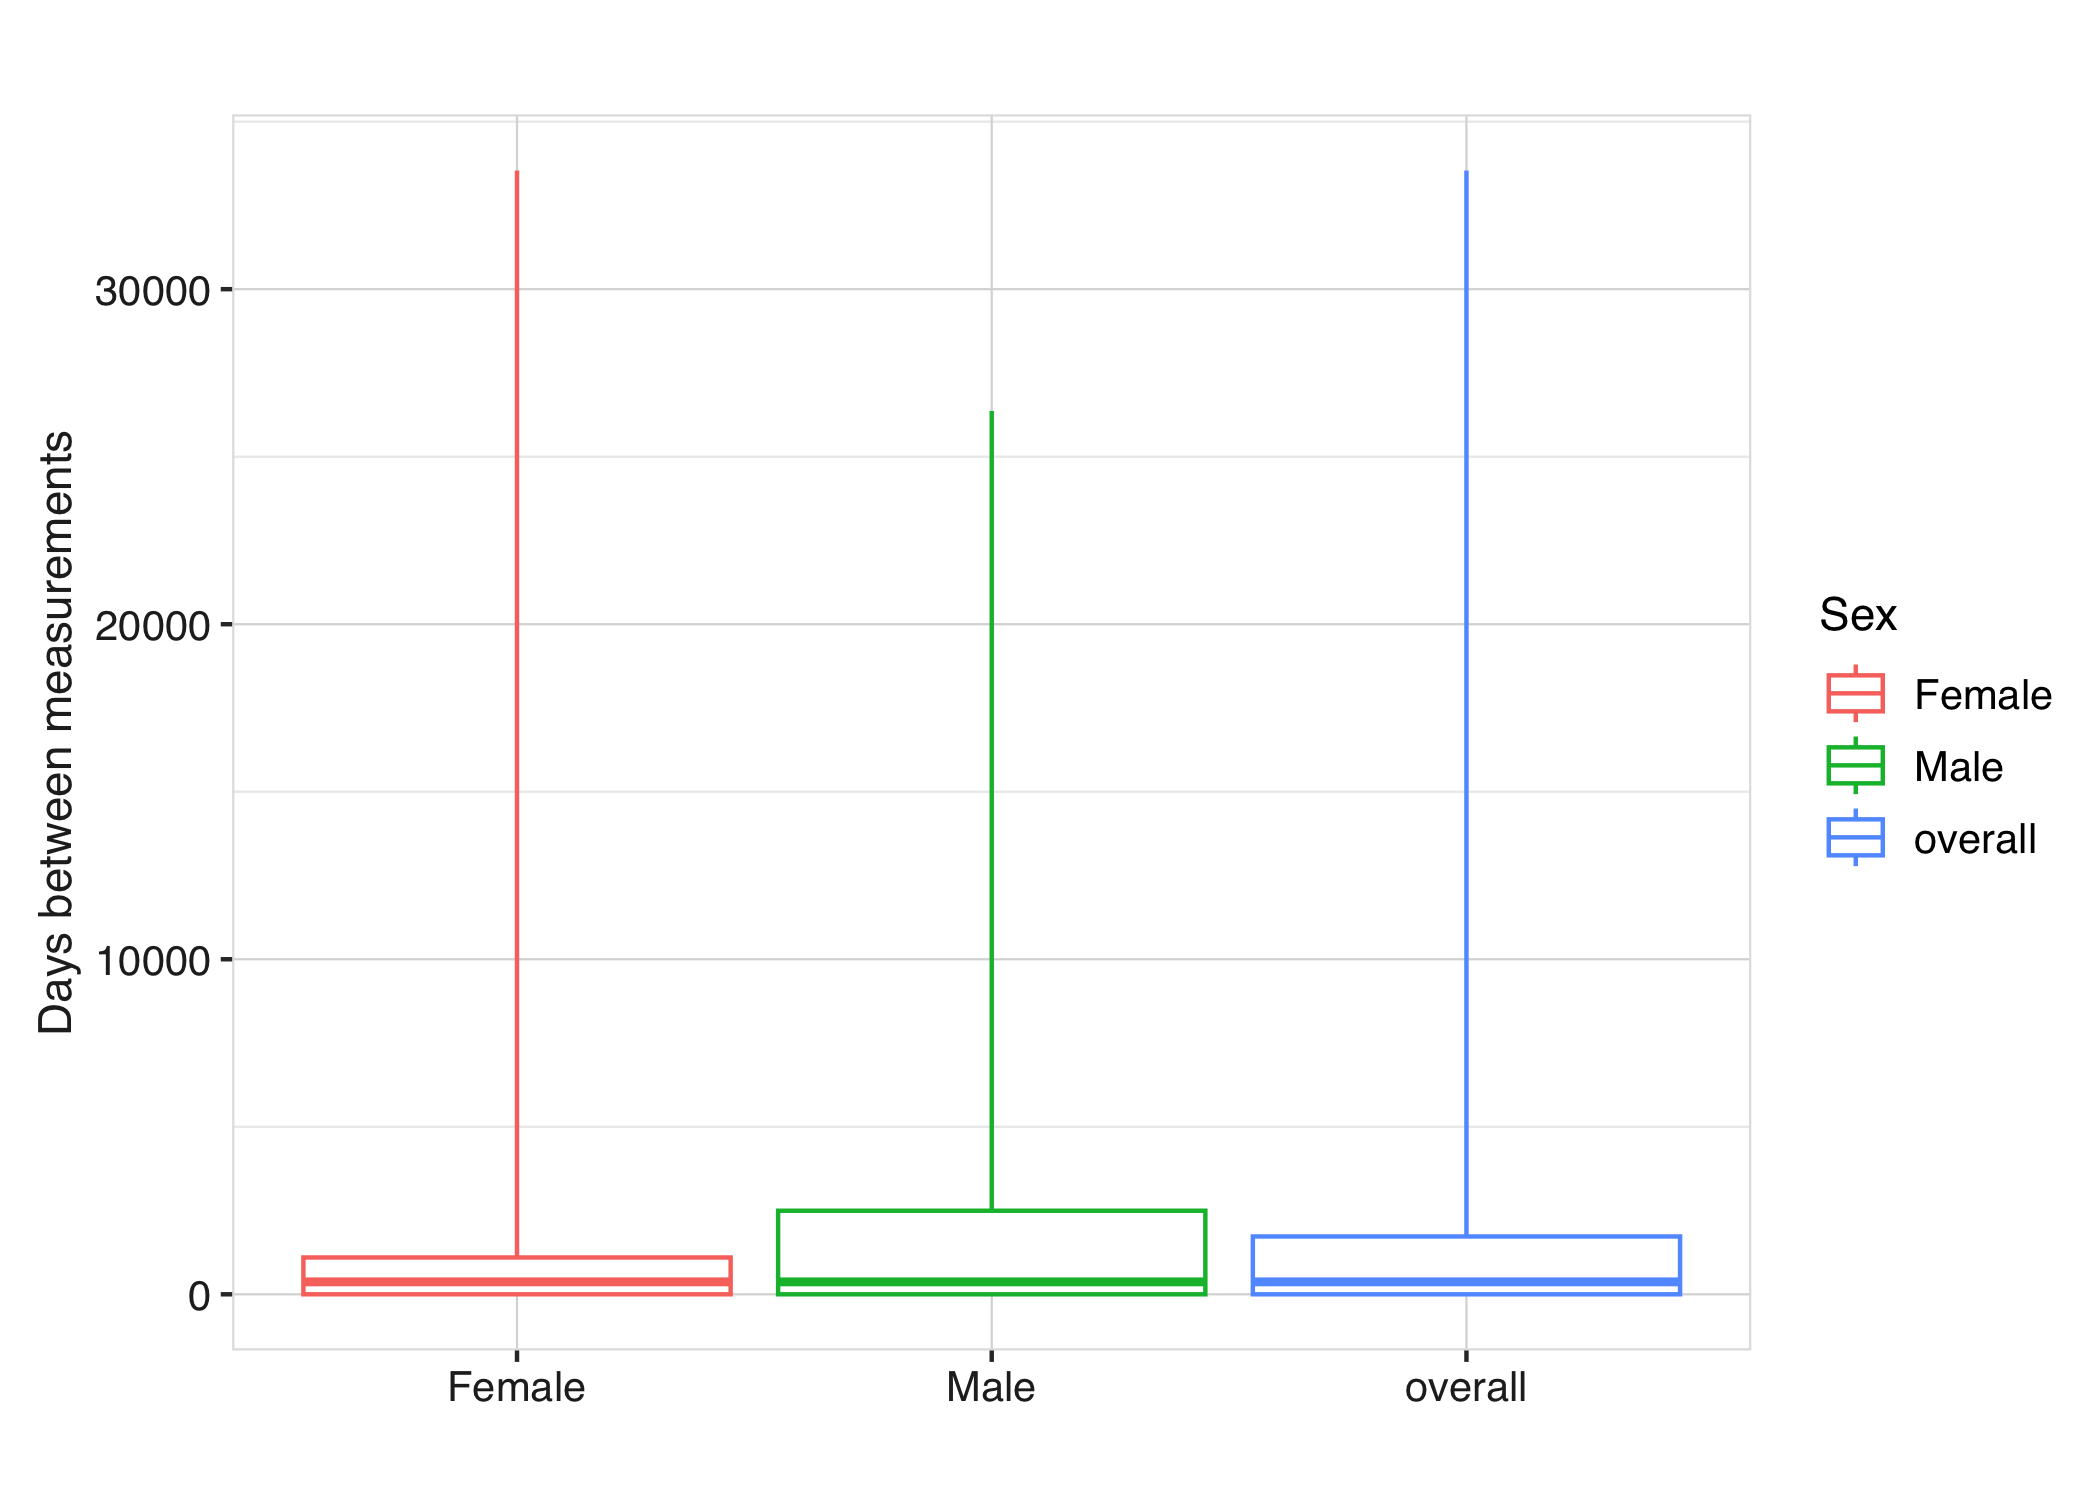
Each diagnostic result can also be visualised using plotting functions. For instance, the time between measurements can be displayed using boxplots:
respiratory_function_measurements |>
  plotMeasurementSummary(
    x = "sex",
    colour = "sex",
    facet = NULL
  )
Visualise results: Shiny App
The package OmopViewer supports MeasurementDiagnostics results and provides a user-friendly way of quickly get a shiny app to visualise these results.
exportStaticApp(result = respiratory_function_measurements, directory = tempdir())