Description
Graphical Univariate/Multivariate Assessments for Normality Assumption.
Description
Graphical methods testing multivariate normality assumption. Methods including assessing score function, and moment generating functions,independent transformations and linear transformations. For more details see Tran (2024),"Contributions to Multivariate Data Science: Assessment and Identification of Multivariate Distributions and Supervised Learning for Groups of Objects." , PhD thesis, <https://our.oakland.edu/items/c8942577-2562-4d2f-8677-cb8ec0bf6234>.
README.md
PlotNormTest
PlotNormTest provides graphical techniques to find evidence of non-normality of a multivariate dataset.
Installation
You can install the development version of PlotNormTest from GitHub with:
# install.packages("devtools")
devtools::install_github("HuongTran53/PlotNormTest")
Example
This is a basic example which shows you how to solve a common problem:
library(PlotNormTest)
set.seed(123)
x <- MASS::mvrnorm(1000, rep(0, 5), diag(5))
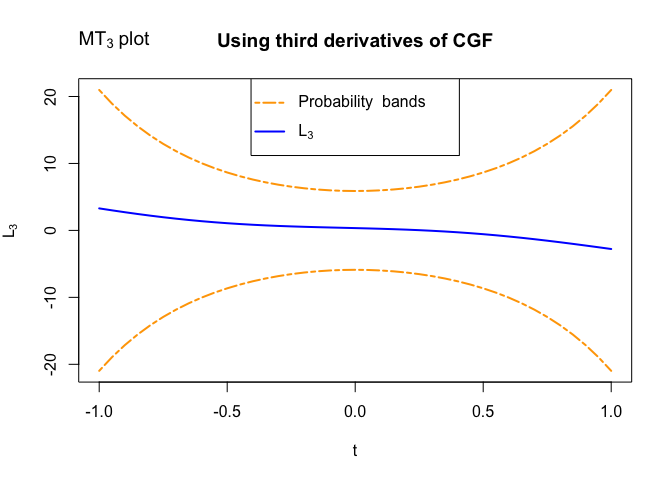
d3hCGF_plot(x); title("Using third derivatives of CGF")
#> [1] "accept"
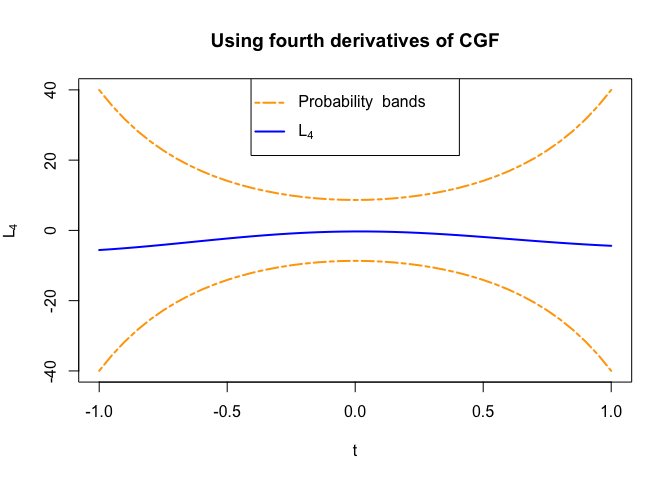
d4hCGF_plot(x); title("Using fourth derivatives of CGF")
#> [1] "accept"
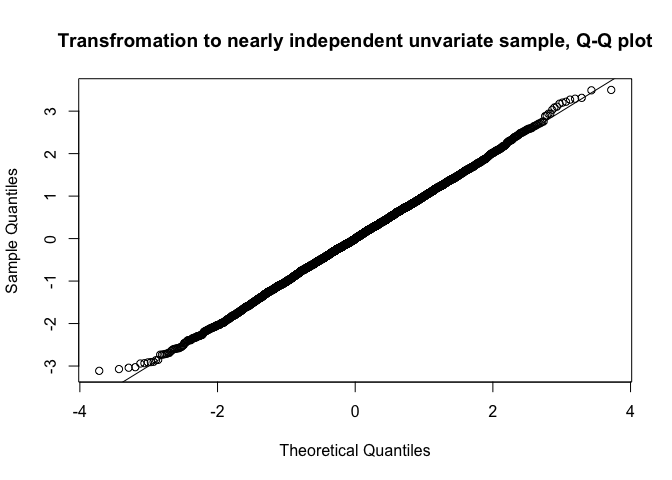
df <- Multi.to.Uni(x)
qqnorm(df$x.new, main = "Transfromation to nearly independent unvariate sample, Q-Q plot"); abline(0, 1)
# Maximum skewness under linear transformation
linear_transform(x, method = "skewness")$max_result
#> [1] 0.01160368