Description
Reference Limits using QQ Methodology.
Description
A collection of routines for finding reference limits using, where appropriate, QQ methodology. All use a data vector X of cases from the reference population. The default is to get the central 95% reference range of the population, namely the 2.5 and 97.5 percentile, with optional adjustment of the range. Along with the reference limits, we want confidence intervals which, for historical reasons, are typically at 90% confidence. A full analysis provides six numbers: – the upper and the lower reference limits, and - each of their confidence intervals. For application details, see Hawkins and Esquivel (2024) <doi:10.1093/jalm/jfad109>.
README.md
QQreflimits
The goal of QQreflimits is to provide routines for finding reference limits using, where appropriate, QQ methodology. All use a data vector X of cases from the reference population. The default is to get the central 95% reference range of the population, namely the 2.5 and 97.5 percentiles.
In some settings we want the 99% range.
Sometimes we want only one of these limits – for example the upper 95% point.
Along with the reference limit, we want a confidence interval which, for historical reasons, is typically at 90% confidence. A full analysis provides six numbers:
- the upper and the lower reference limits, and
- each of their confidence intervals.
Installation
You can install the development version of QQreflimits like so:
install.packages("QQreflimits") # once available on CRAN
Example
This is a basic example which shows you how to solve a common problem:
library(QQreflimits)
# parameters
mu <- 40
sigma <- 10
n <- 120
# identifying winsoring
wins <- trunc(n/40)
# replicable randomization
set.seed(1069)
X <- mu + sigma*rnorm(n)
# replicable randomization with heavy tails
set.seed(1069)
HT <- mu + sigma * rt(n, 5)
# visual settings
par(mfrow=c(2,2))
par(oma=c(0,0,2,0))
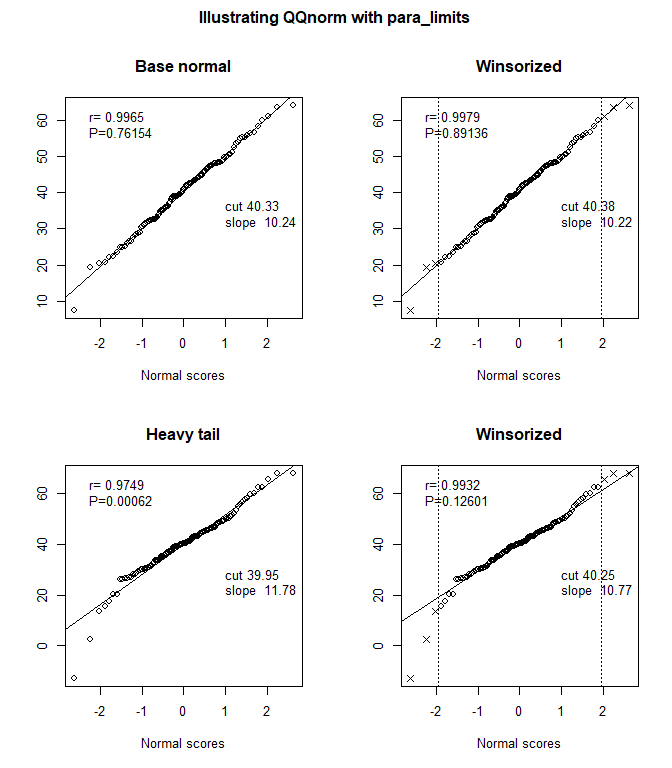
# plot to compare
base <- QQnorm(X, main="Base normal", showsum=TRUE)
title("Illustrating QQnorm with para_limits", outer=TRUE)
basew <- QQnorm(X, main="Winsorized", winsor=wins, showsum=TRUE)
ht <- QQnorm(HT, main="Heavy tail", showsum=TRUE)
htw <- QQnorm(HT, main="Winsorized", winsor=wins, showsum=TRUE)
# evaluate and review
norm_results <- para_limits(mean(X), sd(X), n)
norm_results
#> $lower
#> [1] 20.21278 17.57878 22.84678
#>
#> $upper
#> [1] 60.44854 57.81454 63.08255
#>
#> $effn
#> [1] 120
# evaluate and review with tails
tailed_results <- para_limits(htw$intercept, htw$slope, n, winsor=wins)
tailed_results
#> $lower
#>             ns[QQrange] ns[QQrange]
#>    19.14649    16.25381    22.03916
#>
#> $upper
#>             ns[QQrange] ns[QQrange]
#>    61.35614    58.46346    64.24881
#>
#> $effn
#> [1] 109.5