Description
Generate Random Walks Compatible with the 'tidyverse'.
Description
Generates random walks of various types by providing a set of functions that are compatible with the 'tidyverse'. The functions provided in the package make it simple to create random walks with a variety of properties, such as how many simulations to run, how many steps to take, and the distribution of random walk itself.
README.md
RandomWalker 
![]()
![]()
The goal of RandomWalker is to allow users to easily create Random Walks of different types that are compatible with the tidyverse suite of packages. The package is currently in the experimental stage of development.
Installation
You can install the released version of {TidyDensity} from CRAN with:
install.packages("RandomWalker")
You can install the development version of RandomWalker from GitHub with:
# install.packages("devtools")
devtools::install_github("spsanderson/RandomWalker")
Example
This is a basic example which shows you how to solve a common problem:
library(RandomWalker)
## basic example code
rw30() |>
  head(10)
#> # A tibble: 10 × 3
#>    walk_number step_number      y
#>    <fct>             <int>  <dbl>
#>  1 1                     1  0
#>  2 1                     2 -0.341
#>  3 1                     3 -0.655
#>  4 1                     4 -2.98
#>  5 1                     5 -3.09
#>  6 1                     6 -0.585
#>  7 1                     7 -1.64
#>  8 1                     8 -2.69
#>  9 1                     9 -1.96
#> 10 1                    10 -2.55
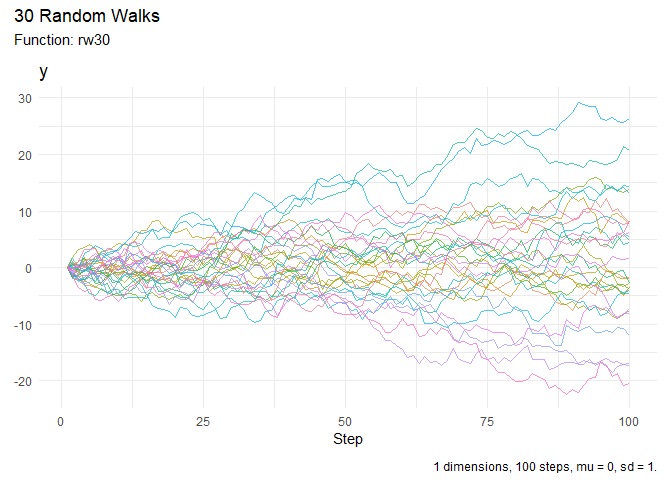
Here is a basic visualization of a Random Walk:
rw30() |>
  visualize_walks()
Here is a basic summary of the random walks:
rw30() |>
  summarize_walks(.value = y)
#> # A tibble: 1 × 16
#>   fns   fns_name dimensions mean_val median range quantile_lo quantile_hi
#>   <chr> <chr>         <dbl>    <dbl>  <dbl> <dbl>       <dbl>       <dbl>
#> 1 rw30  Rw30              1    0.255  0.313  44.2       -11.9        12.1
#> # ℹ 8 more variables: variance <dbl>, sd <dbl>, min_val <dbl>, max_val <dbl>,
#> #   harmonic_mean <dbl>, geometric_mean <dbl>, skewness <dbl>, kurtosis <dbl>

rw30() |>
  summarize_walks(.value = y, .group_var = walk_number)
#> # A tibble: 30 × 17
#>    walk_number fns   fns_name dimensions mean_val median range quantile_lo
#>    <fct>       <chr> <chr>         <dbl>    <dbl>  <dbl> <dbl>       <dbl>
#>  1 1           rw30  Rw30              1    0.177  1.41  15.1       -7.39
#>  2 2           rw30  Rw30              1   -3.40  -3.92  15.5       -8.98
#>  3 3           rw30  Rw30              1    0.427  0.259  7.61      -2.65
#>  4 4           rw30  Rw30              1   14.7   18.1   26.5        0.438
#>  5 5           rw30  Rw30              1    1.25   1.45   9.72      -2.98
#>  6 6           rw30  Rw30              1    3.08   2.43  12.6       -2.58
#>  7 7           rw30  Rw30              1   -3.69  -4.08  11.4       -8.96
#>  8 8           rw30  Rw30              1   -1.81  -1.51   7.36      -5.63
#>  9 9           rw30  Rw30              1   -5.18  -5.33   9.68      -8.86
#> 10 10          rw30  Rw30              1    3.95   4.53  14.3       -2.37
#> # ℹ 20 more rows
#> # ℹ 9 more variables: quantile_hi <dbl>, variance <dbl>, sd <dbl>,
#> #   min_val <dbl>, max_val <dbl>, harmonic_mean <dbl>, geometric_mean <dbl>,
#> #   skewness <dbl>, kurtosis <dbl>