Creates Generative Art Data.
![]()
![]()

![]()
The goal of artpack is to help generative artists of all levels create generative art in R. The artpack package is intended for use with the tidyverse suite. More specifically, with the ggplot2 package.
Installation
You can install {artpack} from CRAN with the following code:
install.packages("artpack")
You can install the development version of artpack from GitHub with:
# install.packages("devtools")
devtools::install_github("Meghansaha/artpack")
Overview
artpack is a package that helps users create generative art in R with a “data-centric” approach and is currently in early development. artpack is intended to be used with ggplot2 for artistic purposes.
What does data-centric mean in this context?
“data-centric” means that the package focuses on providing direct data outputs to the user, as opposed to providing geom_fxs() like most supplemental packages.
Why data outputs? Wouldn’t geoms be more efficient or user-friendly?
Not necessarily. Data outputs are provided to afford the user freedom of manipulation and choice. artpack is developed to make the user’s life easier by making data generation for ggplot2 art easier. All data outputs are intended to be used with existing ggplot2 geoms like geom_polygon() and geom_path(). For artistic purposes, it can be much easier for a user to manipulate direct data frames, as opposed to trying to “hack” geoms.
Brief Examples
artpack can be used to create specified dataframes that will map art when fed into ggplot2 functions:
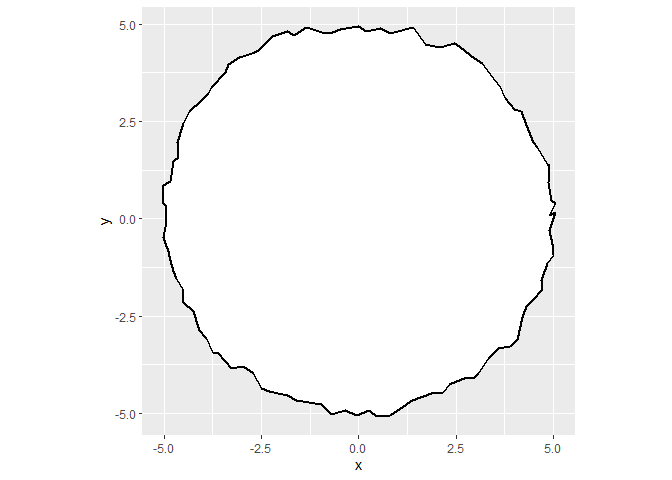
For example, circle_data() creates a data frame that maps a circle on to a ggplot:
#| fig.alt: >
#|   ggplot plot showing a black outlined circle with
#|   irregular, slightly wavy edges centered at the origin
#|   of a coordinate grid, with x and y axes ranging from
#|   approximately -5 to 5, set against a light gray background,
#|   the default ggplot2 plot theme.

# Load your libraries#
library(ggplot2)
#> Warning: package 'ggplot2' was built under R version 4.4.3
library(artpack)

# Use the function to create a data frame#
df_circle <-
  circle_data(
    x = 0,
    y = 0,
    radius = 5,
    color = "black",
    fill = "white"
  )

# Feed it into a ggplot#
df_circle |>
  ggplot(aes(x = x, y = y)) +
  geom_polygon(
    fill = df_circle$fill,
    color = df_circle$color,
    linewidth = 1,
    position = position_jitter(width = .1, height = .2)
  ) +
  coord_equal()
rotator will mathematically “rotate” existing data points in a data frame:
#| fig.alt: >
#|   ggplot plot showing a bright green square rotated
#|   approximately 120 degrees, positioned over a red
#|   outlined square on a coordinate grid with x and y axes
#|   labeled, set against a light gray background, the
#|   default ggplot2 plot theme.


# Load in your libraries#
library(ggplot2)
library(artpack)

# Make a square yourself if you want#
original_square <-
  data.frame(
  x = c(0, 3, 3, 0, 0),
  y = c(0, 0, 3, 3, 0)
)

# Rotate your data points by 120° and...
# ...anchor the rotation around the center of the square#
rotated_square <-
  rotator(
  data = original_square,
  x = x,
  y = y,
  angle = 120,
  anchor = "center"
)

# Plot the original and rotated squares to see the difference#
ggplot() +
  geom_path(
    data = original_square,
    aes(x, y),
    color = "red"
  ) +
  geom_polygon(
    data = rotated_square,
    aes(x, y),
    fill = "green"
  ) +
  coord_equal()
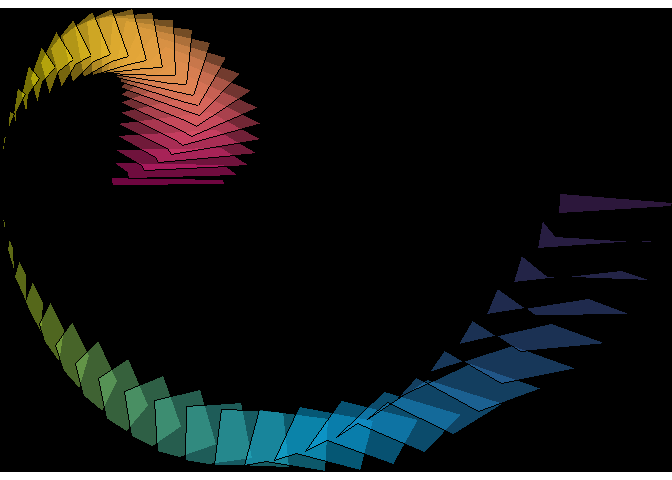
artpack functions are designed to be used in any part of your workflow. Experiment for some cool results:
#| fig-alt: >
#|   Abstract digital visualization featuring flowing, wave-like forms against a black background.
#|   The central element is a smooth, undulating ribbon that transitions through a vibrant spectrum
#|   of colors from magenta/pink on the left, flowing through orange, yellow, green, cyan, and blue
#|   to deep purple on the right. The form has a three-dimensional quality with fine vertical lines
#|   that give it texture and depth, creating the appearance of a dynamic, flowing data visualization
#|   or sound wave.

# Load in your libraries#
library(ggplot2)
library(purrr)
#> Warning: package 'purrr' was built under R version 4.4.3
library(dplyr)
#> Warning: package 'dplyr' was built under R version 4.4.3
#>
#> Attaching package: 'dplyr'
#> The following objects are masked from 'package:stats':
#>
#>     filter, lag
#> The following objects are masked from 'package:base':
#>
#>     intersect, setdiff, setequal, union
library(tibble)
#> Warning: package 'tibble' was built under R version 4.4.3
library(artpack)

# Create a base square with artpack if you want#
square <- square_data(x = 0, y = 0, size = .1, group_var = TRUE)

# Create square specs to be iterated on#
n_square <- 500
scaler <- seq(1, 100, length = n_square)
fills <- art_pals("imagination", n = n_square)
angles <- seq(0, 360, length = n_square)
group_n <- group_numbers(1:n_square)

# Add a random transformation for a little razzle dazzle ✨
theta <- seq(0, 30, length = 250)

# Create your list of specs to be iterated on#
list_opts <-
  list(
    scaler,
    fills,
    angles,
    group_n
  )

# Create the final data frame#
df <-
  pmap(list_opts, ~ rotator(
    square |>
      mutate(
        x = (x + ..1),
        y = (y * ..1),
        fill = ..2,
        group = paste0(group, ..4)
      ),
    x = x, y = y, angle = ..3
  )
  ) |>
  list_rbind() |>
  mutate(
    x = x + cos(theta),
    y = y + sin(theta)
  )

# Plot the final image#
df |>
  ggplot(aes(x = x, y = y, group = group)) +
  theme_void() +
  theme(plot.background = element_rect(fill = "#000000")) +
  geom_path(
    color = df$fill,
    alpha = .2
  )