

Automatic Codebook and Tracking for 'Spark' and 'dplyr' Pipelines.
autocodebook
Automatic codebook and eligibility tracking for data preprocessing pipelines in R.
Write the mutate() — the codebook writes itself.
Built for large-scale epidemiological and social data pipelines using sparklyr, but works equally well with local data frames.
Installation
# From CRAN (after release)
install.packages("autocodebook")

# Development version
# install.packages("devtools")
devtools::install_github("patriciafortesm/autocodebook")
Why autocodebook?
In data preprocessing pipelines, documenting variables is duplicated work. You already wrote the case_when() with all the logic — but then you have to manually write the type, the source columns, the category labels, and the code again in a separate codebook table.
Before (manual codebook — you write everything twice):
# Step 1: Create the variable
df <- df %>%
  mutate(
    sex = case_when(
      cod_sex %in% c(0L, 99L) ~ NA_character_,
      cod_sex == 1L            ~ "Male",
      cod_sex == 2L            ~ "Female",
      TRUE                     ~ NA_character_
    )
  )

# Step 2: Manually document it (duplicated effort!)
register_var("sex",
  type       = "character",
  source     = "cod_sex",
  label      = "Sex",
  categories = "Male; Female; NA (codes 0 and 99)",
  code       = "case_when(cod_sex %in% c(0L, 99L) ~ NA_character_, ...)"
)
After (with autocodebook — you only write the label):
df <- auto_mutate(df,
  labels = list(sex = "Sex"),
  sex = case_when(
    cod_sex %in% c(0L, 99L) ~ NA_character_,
    cod_sex == 1L            ~ "Male",
    cod_sex == 2L            ~ "Female",
    TRUE                     ~ NA_character_
  )
)
# Done. Type, source, categories, and code are captured automatically.
The package uses introspection (rlang) to capture the source code of each expression and infer:
| Field | How it's inferred |
|---|---|
type | Keywords in the code (NA_character_, 0L, /) |
source | Column names referenced in the expression |
categories | Literal values extracted from case_when / if_else |
code | The literal R expression, captured automatically |
What you write vs. what is automatic
| Field | Who fills it | Example |
|---|---|---|
label | You | "Sex", "Household crowding" |
block | You (optional) | "Demographics", "Migration" |
type | Automatic | "character", "integer", "date" |
source | Automatic | "cod_sex", "n_people, n_rooms" |
categories | Automatic | "Male; Female; NA" |
code | Automatic | The full case_when(...) expression |
Quick example
library(dplyr)
library(autocodebook)

cb_init(id_col = "person_id")

df <- df %>%
  # Track raw data
  auto_filter(step = "1. Raw data", description = "All records", TRUE) %>%
  # Eligibility
  auto_filter(step = "2. Valid sex",
              description = "Exclude records with missing sex",
              !is.na(cod_sex)) %>%
  auto_filter(step = "3. Adults",
              description = "Restrict to age >= 18",
              age >= 18) %>%
  # Create derived variables (auto-documented)
  auto_mutate(
    labels = list(
      sex      = "Sex",
      race     = "Self-declared race / ethnicity",
      crowding = "Household crowding (people per room)"
    ),
    block = "Demographics",
    sex = case_when(
      cod_sex == 1L ~ "Male",
      cod_sex == 2L ~ "Female",
      TRUE          ~ NA_character_
    ),
    race = case_when(
      cod_race == 1L ~ "White",
      cod_race == 2L ~ "Black",
      cod_race == 3L ~ "Brown",
      cod_race == 5L ~ "Indigenous",
      TRUE           ~ NA_character_
    ),
    crowding = n_people / n_rooms
  )

# View and export
cb_render()                                              # Codebook as gt table
cb_export(file.path(tempdir(), "codebook.html"))         # Export to HTML
cb_export(file.path(tempdir(), "codebook.docx"))         # Editable Word table
cb_export(file.path(tempdir(), "codebook.xlsx"))         # Editable Excel spreadsheet
track_render()                                           # Eligibility flow as gt table

# Programmatic access
cb_get()      # Codebook as a tibble
track_get()   # Tracking log as a tibble
Standardized HTML report
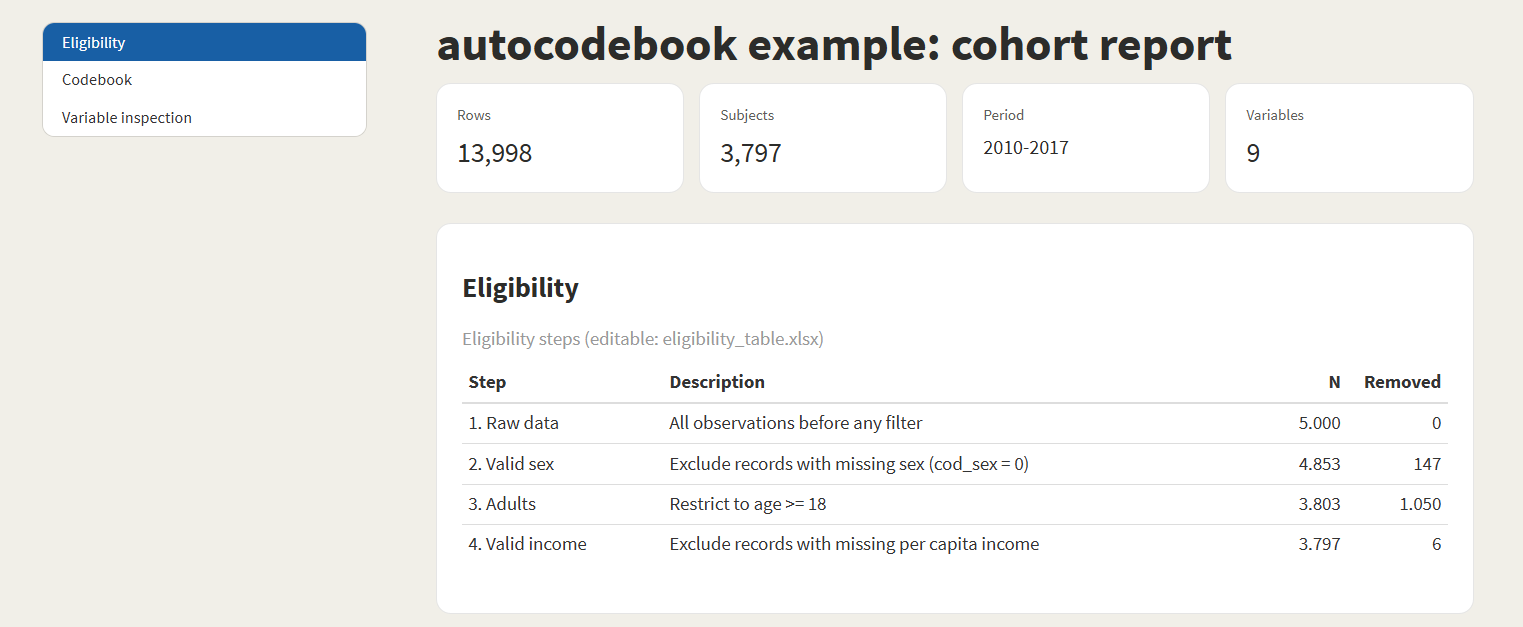
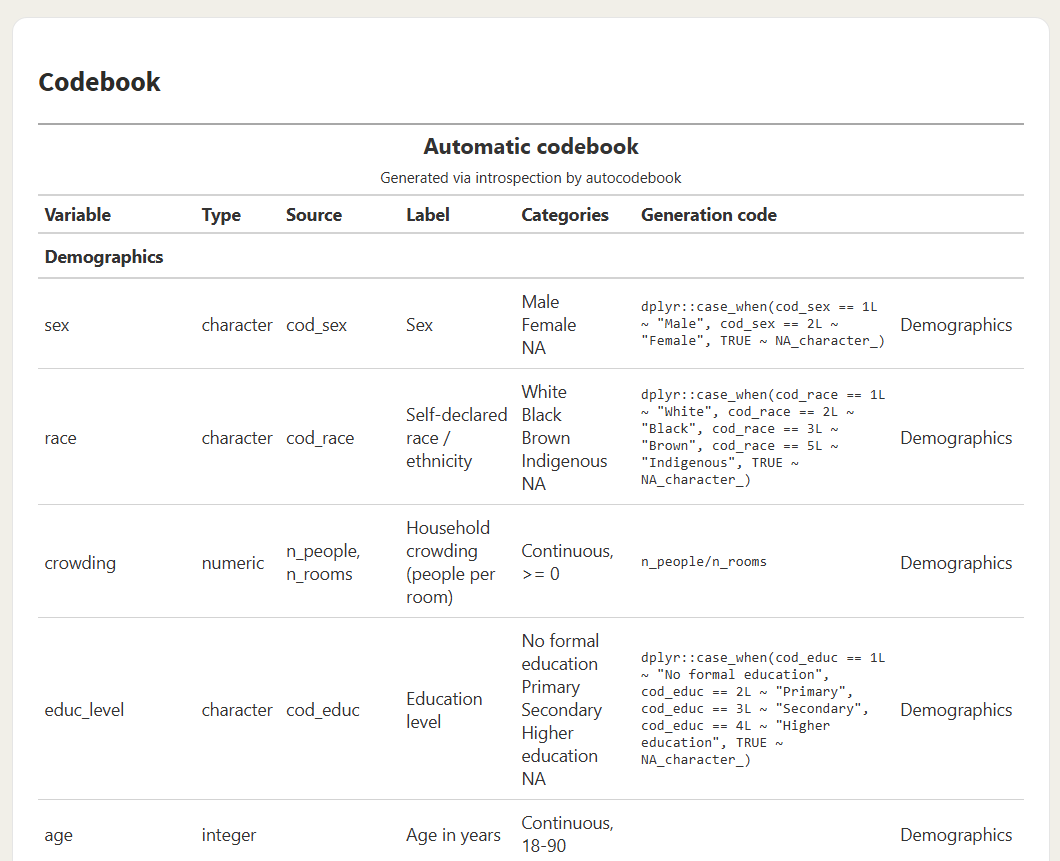
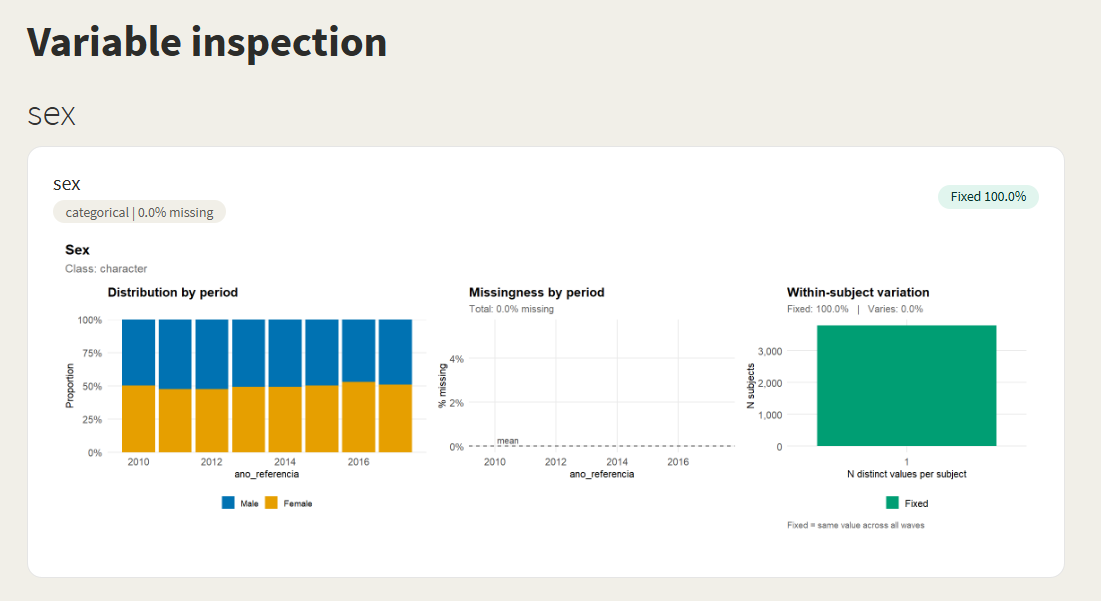
A single call to generate_report() produces a complete dashboard with eligibility flowchart, codebook, and per-variable inspection — ready to share with collaborators or attach as a supplement.
generate_report(
  data        = df,
  type        = "longitudinal",         # or "cross_sectional"
  id_var      = "person_id",
  time_var    = "year",
  output_html = file.path(tempdir(), "report.html")
)
Eligibility section — automatic flowchart with N per step and number of records removed:
Codebook section — all derived variables with type, source, categories, and the exact code that produced them:
Variable inspection — distribution by period, missingness pattern, and within-subject variation (Fixed vs. Varies), per variable:
Editable exports for papers and supplements
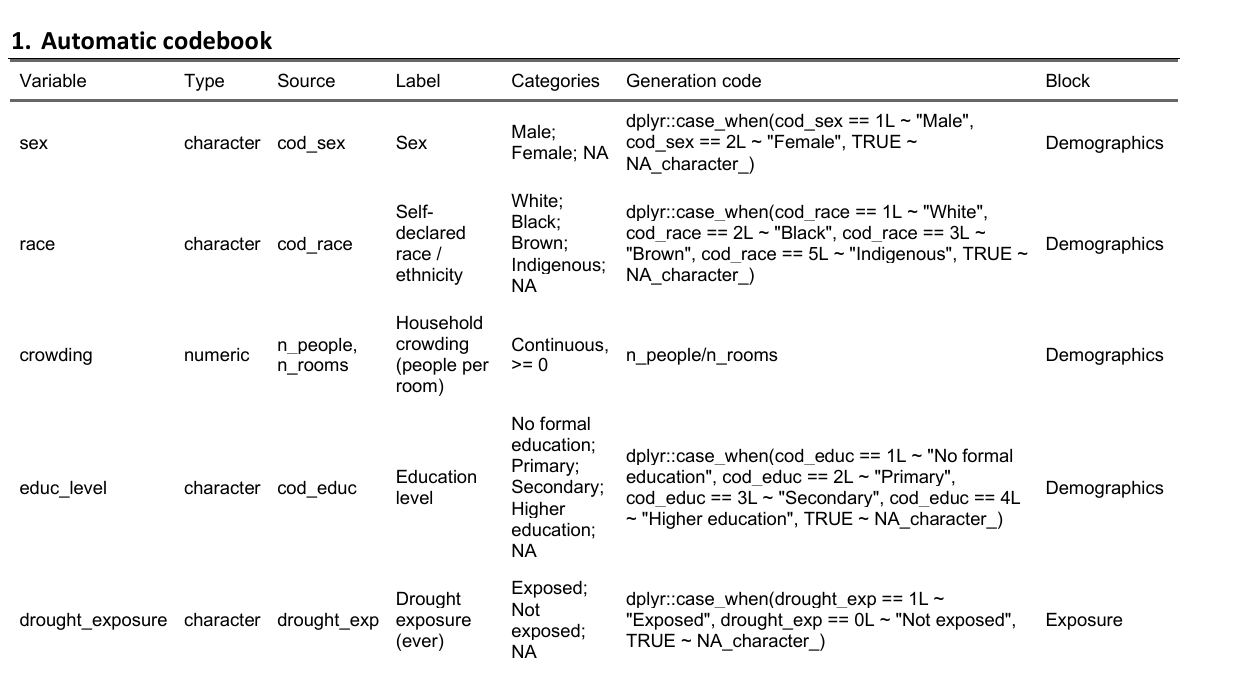
The codebook can be exported as a fully editable Word table (for paper supplements) or Excel spreadsheet (with filters, for review before publication):
Word (.docx) — paste straight into supplementary material:
Excel (.xlsx) — filter, sort, edit, then re-import if needed:

CONSORT-style eligibility flowchart
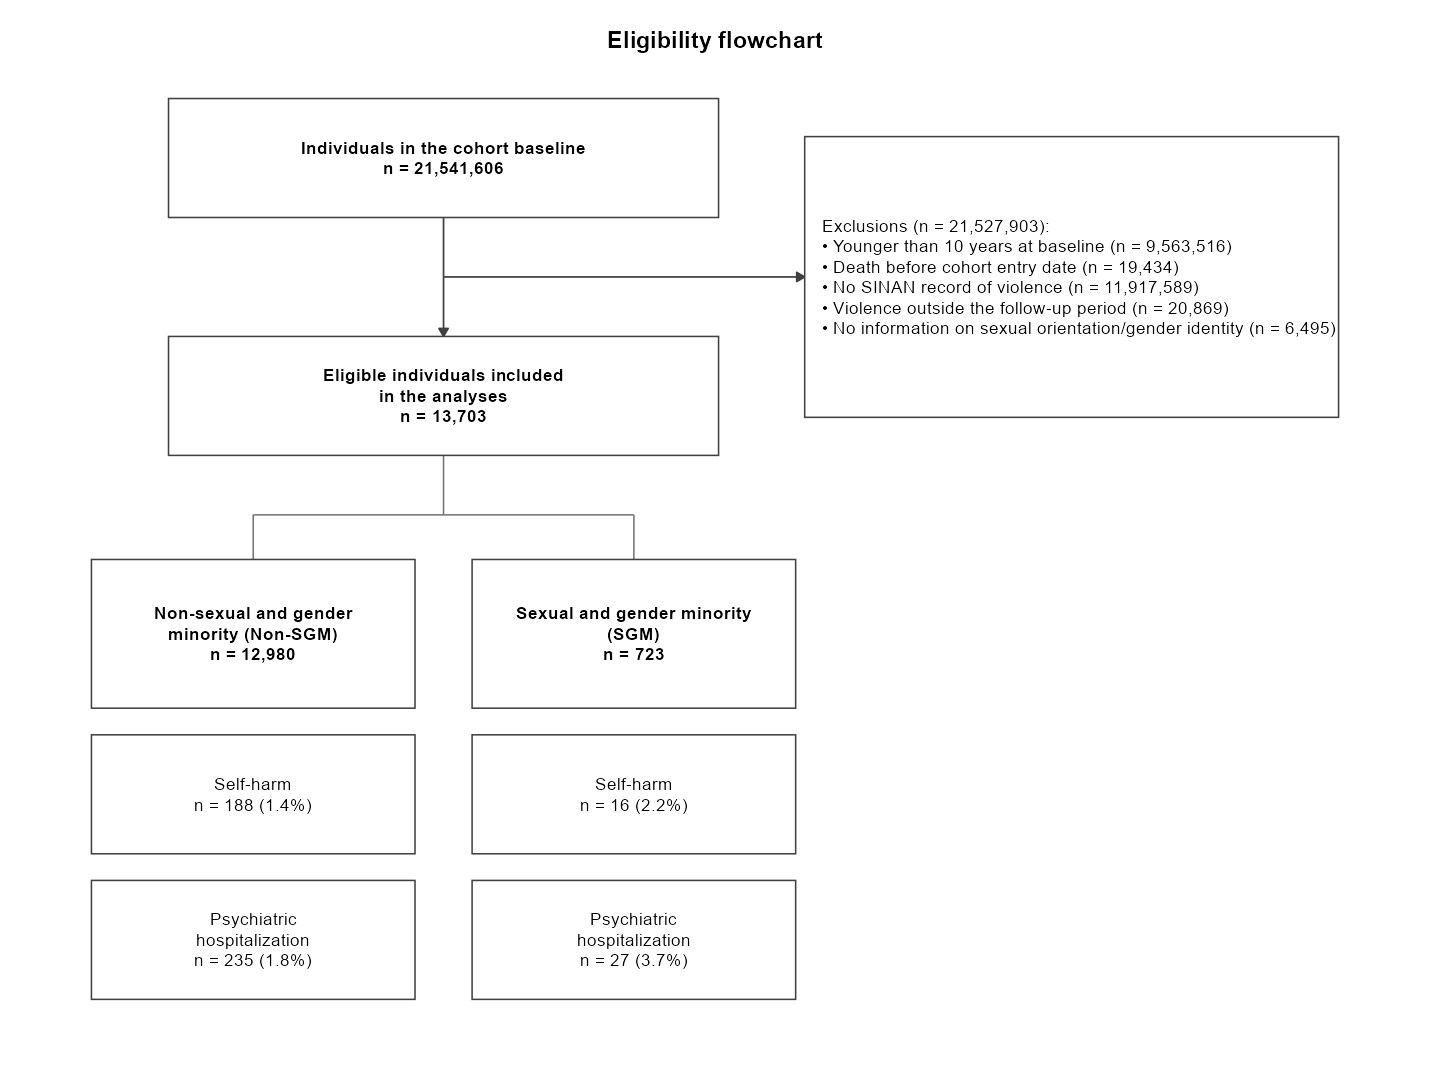
For studies that split the cohort by exposure (and optionally by mediator), track_split() + track_outcomes() capture N and outcome counts at every subgroup combination. flow_diagram() then renders a publication-ready CONSORT-style flowchart directly from the eligibility steps (recorded by auto_filter()) and the flow tree — no manual positioning needed:
df %>%
  auto_filter(step = "age",   description = "Younger than 10 years", age >= 10) %>%
  auto_filter(step = "sinan", description = "No record of violence", has_violence) %>%
  track_split(by = "sgm", label = "SGM status",
              value_labels = c("0" = "Non-SGM", "1" = "SGM")) %>%
  track_outcomes(c("self_harm", "psych"),
                 labels = list(self_harm = "Self-harm",
                               psych     = "Psychiatric hospitalization"))

flow_diagram()       # publication-ready ggplot
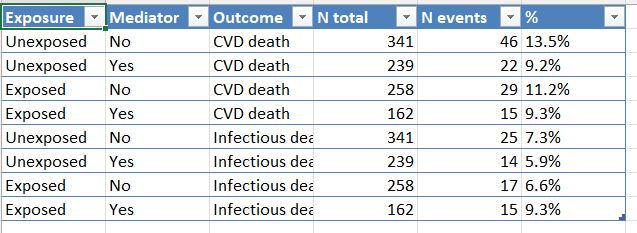
flow_table()         # the same data as a tidy tibble (one row per leaf × outcome)
flow_diagram() — vertical trunk (baseline → aggregated exclusions → eligible cohort), one column per subgroup, and outcome boxes stacked beneath each subgroup:
flow_table() — the same information as a tidy tibble, ready for analysis or editable export (CSV, XLSX):
flow_diagram() returns a ggplot object, so it can be themed, embedded in the standardized report (which does so automatically), or saved with flow_diagram_export(). The export format follows the file extension:
flow_diagram_export("flow.png")    # raster image
flow_diagram_export("flow.pdf")    # vector (also .svg, .eps)
flow_diagram_export("flow.emf")    # editable vector for Word (needs 'devEMF')
flow_diagram_export("flow.docx")   # Word document with the flowchart embedded (needs 'officer')
flow_diagram_export("flow.pptx")   # PowerPoint, fully editable shapes (needs 'rvg' + 'officer')
For the .pptx output, right-click the figure in PowerPoint and choose Ungroup to edit each box and label as a native shape. The tidy table can still be piped into a dedicated diagramming package such as consort or DiagrammeR if you prefer.
Spark example
Works the same way with sparklyr — no API changes:
library(sparklyr)
library(dplyr)
library(autocodebook)

sc <- spark_connect(master = "local")
df <- copy_to(sc, my_data, "my_table")

cb_init(id_col = "person_id")
track_step(df, "1. Raw data")

df <- auto_mutate(df,
  labels = list(
    region_code = "Municipality code (7 digits)",
    state_code  = "State code (first 2 digits)"
  ),
  block = "Geographic variables",
  region_code = lpad(as.character(cod_munic), 7L, "0"),
  state_code  = substring(region_code, 1L, 2L)
)

cb_render()
spark_disconnect(sc)
Big-data optimizations
For large Spark pipelines, several helpers reduce wasted recomputation:
cb_set_default_cache(TRUE)— caches intermediate results across the whole session.auto_filter(..., assume_unique = TRUE)— skips then_distinct(id)call in tracking when the dataset is already unique by ID (orders of magnitude faster on multi-million-row data).cb_checkpoint(sdf, mode = "memory")— materializes a lazytbl_sparkto break long chains of transformations.generate_report(..., cache_data = TRUE)— persists the dataset once before computing all report aggregations.
API reference
Verb wrappers
| Function | Replaces | Registers in | Description |
|---|---|---|---|
auto_mutate() | mutate() | Codebook | Creates variables + auto-documents them |
auto_summarise() | summarise() | Codebook | Summarises + auto-documents new columns |
auto_filter() | filter() | Tracking | Filters + logs how many IDs remain |
Codebook
| Function | Description |
|---|---|
cb_init() | Initialize session and set the unique ID column |
cb_register() | Manually register a variable (for edge cases) |
cb_get() | Returns the full codebook as a tibble |
cb_reset() | Clears all codebook entries |
cb_render() | Renders the codebook as a formatted gt table |
cb_export() | Saves to .html, .csv, .docx, or .xlsx |
Eligibility tracking
| Function | Description |
|---|---|
track_step() | Records a step with unique ID count and number removed |
track_get() | Returns the tracking log as a tibble |
track_reset() | Clears the tracking log |
track_render() | Renders the tracking table as a formatted gt table |
track_export() | Saves to .html, .csv, .docx, or .xlsx |
Flow tree (CONSORT-style)
| Function | Description |
|---|---|
track_split() | Adds a branching level (e.g., by exposure) |
track_outcomes() | Stacks outcome counts on the current leaves |
flow_diagram() | Renders a CONSORT-style flowchart (ggplot) from the flow |
flow_diagram_export() | Saves the flowchart (.png/.pdf/.svg/.emf/.pptx) |
flow_table() | Tidy tibble with one row per leaf x outcome |
flow_get() | Returns the raw flow-tree structure as a list |
flow_reset() | Clears the flow tree |
Reports and session options
| Function | Description |
|---|---|
generate_report() | Builds the full HTML dashboard (+ editable exports) |
cb_checkpoint() | Materializes a lazy tbl_spark |
cb_set_verbose() | Toggles diagnostic messages |
cb_set_default_cache() | Sets the session-wide default for cache |
Parameters for auto_mutate / auto_summarise
auto_mutate(.data,
  labels = list(var1 = "Label for variable 1"),  # only required field
  block  = "Section name",                        # optional: groups in codebook
  var1   = case_when(...)                          # your normal dplyr expressions
)
labels: Named list mapping variable names to descriptions. If omitted, the variable name itself is used.block: Optional string. Groups variables into sections in the rendered codebook (e.g.,"Demographics","Migration flags").
Compatibility
- R >= 4.1
- Works with both
sparklyr(tbl_spark) and local data frames - Compatible with Spark SQL functions (
lpad,substring,lagwithwindow_order, etc.) - No
stringrdependency — uses only base R internally - Report exports require
rmarkdown,ggplot2,patchwork,scales(Suggests) - Editable exports to
.docx/.xlsxrequireofficer,flextable,openxlsx(Suggests)
License
MIT.