Blood Pressure Analysis in R.
bp

bp: Blood Pressure Analysis for R
Cardiovascular disease (CVD) is the leading cause of death worldwide with Hypertension, specifically, affecting over 1.1 billion people annually. The goal of the package is to provide a comprehensive toolbox for analyzing blood pressure (BP) data using a variety of statistical metrics and visualizations to bring more clarity to CVD.
Installation
You can install the released version of bp from CRAN with:
install.packages("bp")
You can install the development version from GitHub with:
# install.packages("devtools")
devtools::install_github("johnschwenck/bp")
For installation with vignettes:
devtools::install_github("johnschwenck/bp", build_vignettes = TRUE)
Sample Data
The package includes six sample data sets:
bp_hypnos: The data set contains ABPM measurements from n= 5subjects with type 2diabetes and obstructive sleep apnea. The recordings are taken every hour during the 24-hour period for each of the two visits that are 3 months apart. Additional information includes sleep/wake indicator for each recording inferred from a wrist-worn actigraphy device. The aim of original study (Rooney et al.2021) is to determine the effect of positive airway pressure treatment of sleep apnea on glycemic control and blood pressure of patients with type 2diabetes. The included data is a subset of the full data described in Rooneyet al.(2021)bp_jhs: The data set consists of HBPM measurements from a 2019 single-subject pilot study during an endured aerobic (endurance) exercise: cycling 5,775 miles from New York City, New York to Seward, Alaska over the course of 95 days. Data was collected using an Omron Evolv wireless blood pressure monitor twice per day (in the morning upon waking up and in the evening before bed). The aim of original study (Schwenck 2019) is to assess blood pressure variability across different environments through time.bp_ghana: The data set contains HBPM measurements on n= 757subjects across 32 community health centers from cluster-randomized trial in Ghana: 389 subjects are in the health insurance coverage (HIC) group and 368 subjects are in another group consisting of a combination of HIC with a nurse-led task-shifting strategy for hypertension control (TASSH)(this group is denoted TASSH + HIC). Baseline blood pressure measurements were collected, with 85% of subjects having available 12 month follow-up measurements. The aim of original study (Ogedegbe et al.2018) is to assess the comparative effectiveness of HIC alone versus the combination of TASSH + HIC on reducing systolic blood pressure among patients with uncontrolled hypertension in Ghana.bp_preg: The data set contains HBPM measurements from n= 209women, each of whom were recorded every 30 minutes during the Pregnancy Day Assessment Clinic (PDAC) observation window for up to a maximum of 240 minutes (i.e. a maximum of 8 total readings per subject per observation window) in addition to an initial “booking” reading before the PDAC assessment. The aim of the original study (McCarthy et al.2015) is to investigate the pregnancy-induced hypertension and pre-eclampsia prediction to determine whether the blood pressure assessment of the first observation window of 1 hour (60 minutes) is sufficiently accurate relative to the standard 4 hour (240 minute) window.bp_children: The data set contains HBPM measurements on n= 1,283 children from Bristol, UK. Three blood pressure readings per visit were collected over the course of two observation periods (at ages 9 and 11). Additionally, information on their physical activity has been collected. The aim of original study (Solomon-Moore et al.2020) is to examine how sedentary behavior affect children progressing through primary school, and to understand the relationship between elevated blood pressure in children and its impact on the development of cardiovascular disease into adulthood.bp_rats: The data set contains AP measurements sampled at 100 Hz of the SS (n1= 9) and SS.13 (n2= 6) genetic strains of Dahl rats. Each mouse was administered either a low sodium or a high sodium diet. The aim of original study (Bugenhagen et al.2010) is to investigate the connection between the dysfunction of the baroreflex control system in Dahl rats and salt-sensitive Hypertension
Intended Functionality
The bp package is designed to allow the user to initialize a processed dataframe through the process_data function by specifying any combination of the following variables present in the user-supplied data set (with the minimum requirement that SBP and DBP are included). The package will then utilize the processed dataframe to calculate various metrics from medical and statistical literature and provide visualizations. Perhaps the most useful user-friendly feature of the package is the ability to generate a visualization report to discern relationships and assess blood pressure stage progression among subjects.
The package has the ability to make use of the following physiological variables (expressed as integers):
- Systolic Blood Pressure (
SBP) measured in mmHg - Diastolic Blood Pressure (
DBP) measured in mmHg - Arterial Pressure (
AP) (if applicable) - Heart Rate (
HR) measured in bpm - Pulse Pressure (
PP) measured in mmHg which is calculated as SBP - DBP - Mean Arterial Pressure (
MAP) measured in mmHg - Rate Pressure Product (
RPP) which is calculated as SBP multiplied by resting HR
There are also processing functionality for arterial pressure (AP) data which include the following inputs: * A column corresponding to the AP data (AP) * Time elapsed (time_elap)
Furthermore, there are a suite of processing capabilities within the process_data function such as:
DATE_TIME: A column coreresponding to a date/time object (typicallyas.POSIXctformat) such as12/1/2020 13:42:07ID: Identification of individualsVISIT: The visit of each individual, if more than one (integer)WAKE: A binary indicator where 1 denotes awake and 0 denotes asleep (binary 1 or 0)GROUP: An arbitrary column that can be used to group data according to this category (such as gender or age)EOD: Denotes the end-of-day which can be adjusted for situations where individuals may take readings after midnightDATA_SCREEN: A screening proceedure to remove outliers based on upper and lower limits of BP readingsAGG: An aggregation option to average consecutive readings taken within quick successionCHRON_ORDER: Adjust the chronology of the readings (chronological vs reverse-chronological)TZ: Time zone adjustment
After all available variables are identified and processed, the resulting processed dataframe is used for all other functions.
Unique to the bp package is the ability to create additional columns that might not originally be present in the supplied data set. At current, the following additional columns will be created:
TIME_OF_DAY- Corresponds to the Time of Day (Morning, Afternoon, Evening, or Night) based onDATE_TIMEcolumnDAY_OF_WEEK- Corresponds to the Day of the week: a useful column for table visuals. Based onDATE_TIMEcolumnSBP_CATEGORY- Systolic Blood Pressure Stages (Low, Normal, Elevated, Stage 1, Stage 2, Crisis) as defined by the American Heart Association (AHA)DBP_CATEGORY- Diastolic Blood Pressure Stages (Low, Normal, Elevated, Stage 1, Stage 2, Crisis) as defined by the American Heart Association (AHA)BP_CLASS- A two-to-one mapping of SBP and DBP readings that expands on the original AHA categories using a more recent adaptation by (Lee et al 2018)
See examples below for further details.
Available Metrics
The package will then utilize the above variables to calculate various metrics from medical and statistical literature in order to quantify and classify the variability of the readings into their respective categories of hypertension (normal, elevated, or hypertensive).
The following metrics are currently offered through the bp package:
| Function | Metric Name | Source |
|---|---|---|
bp_arv | Average Real Variability | Mena et al (2005) |
bp_center | Mean and Median | Amaro Lijarcio et al (2006) |
bp_cv | Coefficient of Variation | Munter et al (2011) |
bp_mag | Blood Pressure Magnitude (peak and trough) | Munter et al (2011) |
bp_range | Blood Pressure Range | Levitan et al (2013) |
bp_sv | Successive Variation | Munter et al (2011) |
bp_sleep_metrics | Blood Pressure Sleep Metrics | (Multiple - see documentation) |
bp_stages | Blood Pressure Stages Classification | American Heart Association |
bp_stats | Aggregation of statistical summaries | N/A |
dip_calc | Nocturnal Dipping % and Classification | Okhubo et al (1997) |
The following visualization functions are currently offered through the bp package:
| Function | Visualization Type |
|---|---|
bp_scatter | Scatter plot of BP stages |
bp_ts_plots | Time series plots |
bp_hist | Histograms of BP stages |
dip_class_plot | Dipping % category plot |
bp_report | Exportable report of BP summary |
Example - HYPNOS data
There are two main steps involved with the bp package: The data processing step and the functionality / analysis step.
- Load and process data into a new usable dataframe for all further analysis using the
process_datafunction
#devtools::install_github("johnschwenck/bp")
library(bp)

## Load bp_hypnos
data(bp_hypnos)

## Process bp_hypnos
hypnos_proc <- process_data(bp_hypnos,
                     sbp = 'syst',
                     dbp = 'diast',
                     date_time = 'date.time',
                     hr = 'hr',
                     pp = 'PP',
                     map = 'MaP',
                     rpp = 'Rpp',
                     id = 'id',
                     visit = 'Visit',
                     wake = 'wake')
#> 2 values exceeded the DUL or DLL thresholds and were coerced to NA
NOTE: the process_data function is insensitive to capitalization of the supplied data column names. For this example, even though the original column name “SYST” exists in the bp_hypnos, “syst” is still an acceptable name to be given to the function as shown. For emphasis, all of the above column names were intentionally entered using the wrong capitalization.
SBP and DBP must be specified for any other functions to work properly.
- Using the newly processed
hypnos_proc, we can now calculate various metrics. Now that the included rawbp_hypnosdataset has been processed intohypnos_proc, we can now instead rely on this new dataframe to calculate various metrics and visualizations. The calculation of the nocturnal dipping classification is shown below, using a subset of only two of the subjects for comparison (subjects 70417 and 70435):
dip_calc(hypnos_proc, subj = c(70417, 70435))
#> [[1]]
#> # A tibble: 8 x 6
#> # Groups:   ID, VISIT [4]
#>   ID    VISIT WAKE  avg_SBP avg_DBP     N
#>   <fct> <fct> <fct>   <dbl>   <dbl> <int>
#> 1 70417 1     0        123.    60.5    10
#> 2 70417 1     1        128     66.6    20
#> 3 70417 2     0        136.    60.5     8
#> 4 70417 2     1        136.    65.6    17
#> 5 70435 1     0        106.    63       6
#> 6 70435 1     1        129.    82.1    23
#> 7 70435 2     0        136.    79.2     9
#> 8 70435 2     1        123.    72.5    20
#>
#> [[2]]
#> # A tibble: 4 x 6
#> # Groups:   ID [2]
#>   ID    VISIT  dip_sys class_sys  dip_dias class_dias
#>   <fct> <fct>    <dbl> <chr>         <dbl> <chr>
#> 1 70417 1      0.0359  non-dipper   0.0916 non-dipper
#> 2 70417 2     -0.00450 reverse      0.0784 non-dipper
#> 3 70435 1      0.179   dipper       0.233  extreme
#> 4 70435 2     -0.104   reverse     -0.0927 reverse
In terms of statistical metrics, the bp_stats function aggregates many of the variability and center metrics into one table which makes comparing the different measures to one another very convenient. Let’s suppose for this example that we wanted to further analyze these two subjects by their BP_CLASS: we would include add_groups = "BP_CLASS" as an additional argument (note that capitalization does not matter).
bp_stats(hypnos_proc, subj = c(70417, 70435), add_groups = "bp_class", bp_type = 1)
#> # A tibble: 35 x 16
#> # Groups:   ID, VISIT, WAKE [8]
#>    ID        N VISIT WAKE  BP_CLASS SBP_mean SBP_med    SD   ARV    SV    CV
#>    <fct> <int> <fct> <fct> <ord>       <dbl>   <dbl> <dbl> <dbl> <dbl> <dbl>
#>  1 70417     5 1     0     Normal       114.     114  3.51  3.5   4.74 3.07
#>  2 70417     3 1     0     Elevated     125.     125  1.53  1.5   1.58 1.22
#>  3 70417     2 1     0     ISH - S2     143      143  2.83  4     4    1.98
#>  4 70417     3 1     1     Normal       116.     118  4.04  3.5   4.95 3.49
#>  5 70417     9 1     1     Elevated     125.     124  2.54  3.25  3.71 2.03
#>  6 70417     6 1     1     ISH - S1     134.     133  2.42  2.4   2.83 1.81
#>  7 70417     2 1     1     ISH - S2     144      144  1.41  2     2    0.982
#>  8 70417     3 2     0     Elevated     124      122  4.36  4     5    3.52
#>  9 70417     2 2     0     ISH - S1     133      133  1.41  2     2    1.06
#> 10 70417     3 2     0     ISH - S2     151      151  0     0     0    0
#> # ... with 25 more rows, and 5 more variables: SBP_max <dbl>, SBP_min <dbl>,
#> #   SBP_range <dbl>, Peak <dbl>, Trough <dbl>
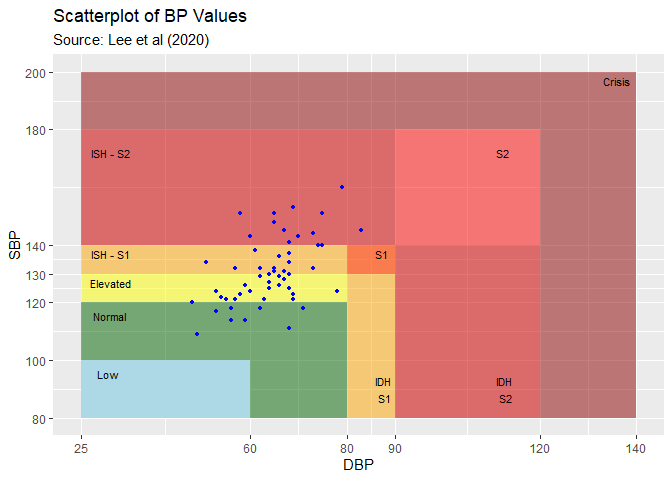
Here is an example of the bp_scatter function for subject 70417:
bp_scatter(hypnos_proc, subj = 70417)