Simulation of Plasma Caffeine Concentrations by Using Population Pharmacokinetic Model.
Caffeine Concentration Predictor
Caffeine Concentration Predictorhttps://asan.shinyapps.io/caffCaffeine Concentration Predictoris open to everyone. We are happy to take your input. Please fork the repo, modify the codes and submit a pull request. https://github.com/shanmdphd/caff
Reference
This work is solely dependent on the interesting paper published in Eur J Pediatr in 2015.
- "Prediction of plasma caffeine concentrations in young adolescents following ingestion of caffeinated energy drinks: a Monte Carlo simulation." Eur J Pediatr. 2015 Dec;174(12):1671-8. doi: 10.1007/s00431-015-2581-x https://www.ncbi.nlm.nih.gov/pubmed/26113286
- "Clinical pharmacokinetics and pharmacodynamics: concepts and applications, 4th edition" Lippincott Williams & Wilkins. 2011. ISBN 978-0-7817-5009-7
The pharmacokinetic parameters from the paper were derived and used in the app as follows:
$$ \begin{split} \begin{bmatrix} \eta_1 \newline \eta_2 \newline \eta_3 \end{bmatrix} & \sim MVN \bigg( \begin{bmatrix} 0 \newline 0 \newline 0 \end{bmatrix} , \begin{bmatrix} 0.1599 & 6.095 \cdot 10^{-2} & 9.650 \cdot 10^{-2} \newline 6.095 \cdot 10^{-2} & 4.746 \cdot 10^{-2} & 1.359 \cdot 10^{-2} \newline 9.650 \cdot 10^{-2} & 1.359 \cdot 10^{-2} & 1.004 \end{bmatrix} \bigg) \newline \newline CL\ (mg/L) & = 0.09792 \cdot W \cdot e^{\eta1} \newline V\ (L) & = 0.7219 \cdot W \cdot e^{\eta2} \newline k_a\ (1/hr) & = 4.268 \cdot e^{\eta3} \newline \newline k\ (1/hr) & = \frac{CL}{V} \newline t_{1/2}\ (hr) & = \frac{0.693}{k} \newline t_{max}\ (hr) & = \frac{ln(k_a) - ln(k)}{k_a - k} \newline C_{max}\ (mg/L) & = \frac{Dose}{V} \cdot \frac{k_a}{k_a - k} \cdot (e^{-k \cdot t_{max}} - e^{-k_a \cdot t_{max}}) \newline AUC\ (mg \cdot hr / L) & = \frac{Dose}{CL} \newline \newline C_{av,ss} & = \frac{Dose}{CL \cdot \tau} \newline AI & = \frac{1}{1-e^{-k_e \cdot \tau}} \newline \end{split} $$ (Abbreviation: $AI$, accumulation index; $AUC$, area under the plasma drug concentration-time curve; $CL$, total clearance of drug from plasma; $C_{av,ss}$, average drug concentration in plasma during a dosing interval at steady state on administering a fixed dose at equal dosing intervals; $C_{max}$, highest drug concentration observed in plasma; $MVN$, multivariate normal distribution; $V$, Volume of distribution (apparent) based on drug concentration in plasma; $W$, body weight (kg); $\eta$, interindividual random variability parameter; $k$, elimination rate constant; $k_a$, absorption rate constant; $\tau$, dosing interval; $t_{1/2}$, elimination half-life)
R Packages
- H. Wickham. ggplot2: Elegant Graphics for Data Analysis. Springer-Verlag New York, 2009.
- Winston Chang, Joe Cheng, JJ Allaire, Yihui Xie and Jonathan McPherson (2016). shiny: Web Application Framework for R. R package version 0.14.2. https://CRAN.R-project.org/package=shiny
- JJ Allaire, Jeffrey Horner, Vicent Marti and Natacha Porte (2015). markdown: 'Markdown' Rendering for R. R package version 0.7.7. https://CRAN.R-project.org/package=markdown
- Hadley Wickham and Romain Francois (2016). dplyr: A Grammar of Data Manipulation. R package version 0.5.0. https://CRAN.R-project.org/package=dplyr
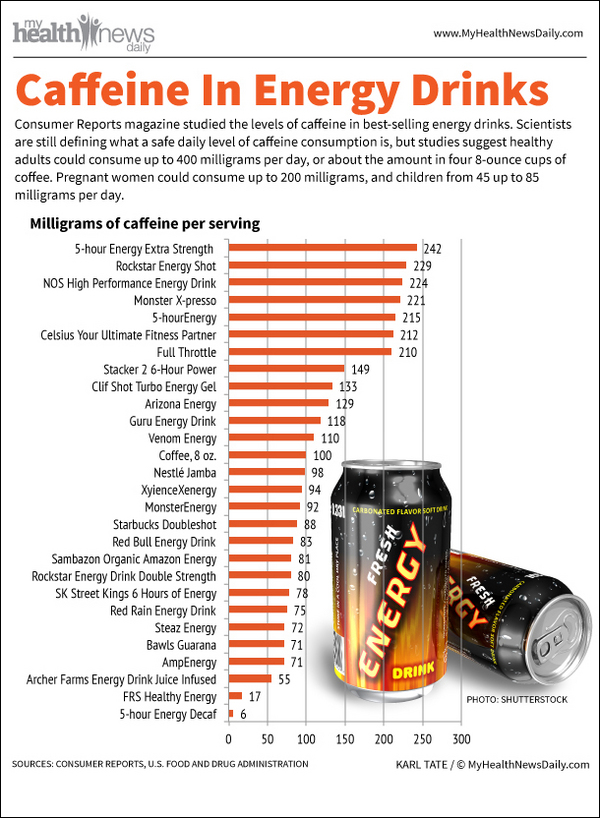
Caffeine contents.
