Fluid Data Transformations.
cdata is a general data re-shaper that has the great virtue of adhering to Raymond’s “Rule of Representation”, and using Codd’s “Guaranteed Access Rule”.
Fold knowledge into data, so program logic can be stupid and robust.
The Art of Unix Programming, Erick S. Raymond, Addison-Wesley, 2003
Rule 2: The guaranteed access rule.
Each and every datum (atomic value) in a relational data base is guaranteed to be logically accessible by resorting to a combination of table name, primary key value and column name.
The point being: it is much easier to reason about data than to try to reason about code, so using data to control your code is often a very good trade-off. cdata also has a Python implementation that it can inter-operate with in the data_algebra package (example here).

Briefly: cdata supplies data transform operators that:
- Work on local data or with any
DBIdata source. - Are powerful generalizations of the operations commonly called
pivotandun-pivot. - Allow for example-driven graphical specification of data transforms or data layout control.
- Work in-memory or with
SQLdatabases.
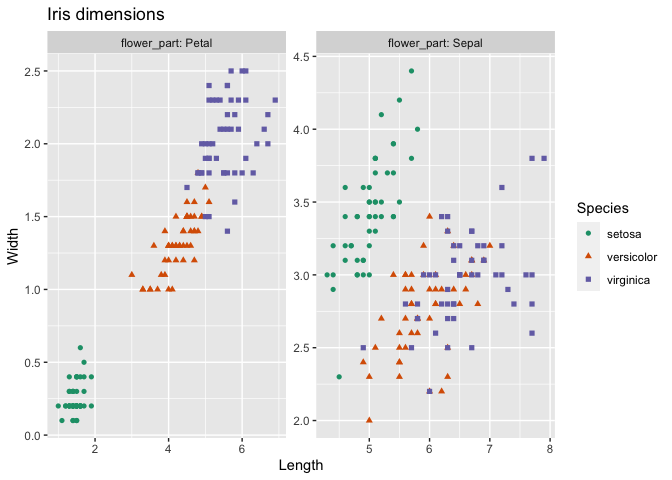
A quick example: plot iris petal and sepal dimensions in a faceted graph.
iris <- data.frame(iris)
iris$iris_id <- seq_len(nrow(iris))

# show the data
head(iris)
 #    Sepal.Length Sepal.Width Petal.Length Petal.Width Species iris_id
 #  1          5.1         3.5          1.4         0.2  setosa       1
 #  2          4.9         3.0          1.4         0.2  setosa       2
 #  3          4.7         3.2          1.3         0.2  setosa       3
 #  4          4.6         3.1          1.5         0.2  setosa       4
 #  5          5.0         3.6          1.4         0.2  setosa       5
 #  6          5.4         3.9          1.7         0.4  setosa       6

library("ggplot2")
library("cdata")
 #  Loading required package: wrapr

#
# build a control table with a "key column" flower_part
# and "value columns" Length and Width
#
controlTable <- wrapr::qchar_frame(
  "flower_part", "Length"     , "Width"     |
    "Petal"    , Petal.Length , Petal.Width |
    "Sepal"    , Sepal.Length , Sepal.Width )

transform <- rowrecs_to_blocks_spec(
  controlTable,
  recordKeys = c("iris_id", "Species"))

# do the unpivot to convert the row records to block records
iris_aug <- iris %.>% transform

# show the tranformed data
head(iris_aug)
 #    iris_id Species flower_part Length Width
 #  1       1  setosa       Petal    1.4   0.2
 #  2       1  setosa       Sepal    5.1   3.5
 #  3       2  setosa       Petal    1.4   0.2
 #  4       2  setosa       Sepal    4.9   3.0
 #  5       3  setosa       Petal    1.3   0.2
 #  6       3  setosa       Sepal    4.7   3.2

# plot the graph
ggplot(iris_aug, aes(x=Length, y=Width)) +
  geom_point(aes(color=Species, shape=Species)) +
  facet_wrap(~flower_part, labeller = label_both, scale = "free") +
  ggtitle("Iris dimensions") +  scale_color_brewer(palette = "Dark2")

# show the transform
print(transform)
 #  {
 #   row_record <- wrapr::qchar_frame(
 #     "iris_id"  , "Species", "Petal.Length", "Petal.Width", "Sepal.Length", "Sepal.Width" |
 #       .        , .        , Petal.Length  , Petal.Width  , Sepal.Length  , Sepal.Width   )
 #   row_keys <- c('iris_id', 'Species')
 #
 #   # becomes
 #
 #   block_record <- wrapr::qchar_frame(
 #     "iris_id"  , "Species", "flower_part", "Length"    , "Width"     |
 #       .        , .        , "Petal"      , Petal.Length, Petal.Width |
 #       .        , .        , "Sepal"      , Sepal.Length, Sepal.Width )
 #   block_keys <- c('iris_id', 'Species', 'flower_part')
 #
 #   # args: c(checkNames = TRUE, checkKeys = FALSE, strict = FALSE, allow_rqdatatable = FALSE)
 #  }

# show the representation of the transform
unclass(transform)
 #  $controlTable
 #    flower_part       Length       Width
 #  1       Petal Petal.Length Petal.Width
 #  2       Sepal Sepal.Length Sepal.Width
 #
 #  $recordKeys
 #  [1] "iris_id" "Species"
 #
 #  $controlTableKeys
 #  [1] "flower_part"
 #
 #  $checkNames
 #  [1] TRUE
 #
 #  $checkKeys
 #  [1] FALSE
 #
 #  $strict
 #  [1] FALSE
 #
 #  $allow_rqdatatable
 #  [1] FALSE
More details on the above example can be found here. A tutorial on how to design a controlTable can be found here. And some discussion of the nature of records in cdata can be found here.
A more detailed video tutorial is available here.
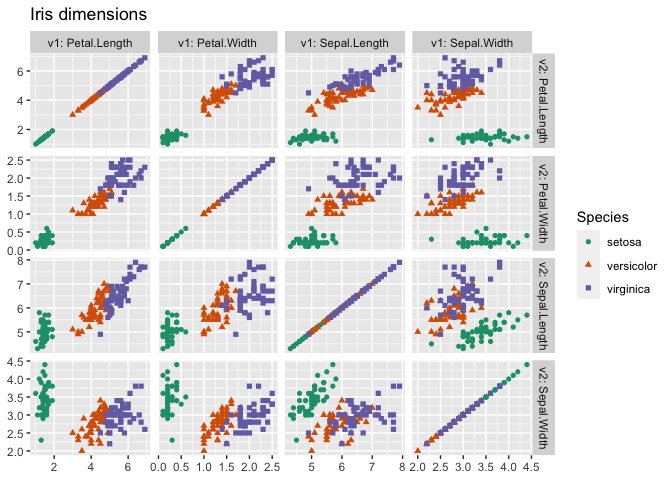
We can also exhibit a larger example of using cdata to create a scatter-plot matrix, or pair plot:
iris <- data.frame(iris)
iris$iris_id <- seq_len(nrow(iris))

library("ggplot2")
library("cdata")

# declare our columns of interest
meas_vars <- qc(Sepal.Length, Sepal.Width, Petal.Length, Petal.Width)
category_variable <- "Species"

# build a control with all pairs of variables as value columns
# and pair_key as the key column
controlTable <- data.frame(expand.grid(meas_vars, meas_vars,
                                       stringsAsFactors = FALSE))
# one copy of columns is coordinate names second copy is values
controlTable <- cbind(controlTable, controlTable)
# name the value columns value1 and value2
colnames(controlTable) <- qc(v1, v2, value1, value2)
transform <- rowrecs_to_blocks_spec(
  controlTable,
  recordKeys = c("iris_id", "Species"),
  controlTableKeys = qc(v1, v2),
  checkKeys = FALSE)

# do the unpivot to convert the row records to multiple block records
iris_aug <- iris %.>% transform
# alternate notation: layout_by(transform, iris)


ggplot(iris_aug, aes(x=value1, y=value2)) +
  geom_point(aes_string(color=category_variable, shape=category_variable)) +
  facet_grid(v2~v1, labeller = label_both, scale = "free") +
  ggtitle("Iris dimensions") +
  scale_color_brewer(palette = "Dark2") +
  ylab(NULL) +
  xlab(NULL)

# show transform
print(transform)
 #  {
 #   row_record <- wrapr::qchar_frame(
 #     "iris_id"  , "Species", "Sepal.Length", "Sepal.Width", "Petal.Length", "Petal.Width" |
 #       .        , .        , Sepal.Length  , Sepal.Width  , Petal.Length  , Petal.Width   )
 #   row_keys <- c('iris_id', 'Species')
 #
 #   # becomes
 #
 #   block_record <- wrapr::qchar_frame(
 #     "iris_id"  , "Species", "v1"          , "v2"          , "value1"    , "value2"     |
 #       .        , .        , "Sepal.Length", "Sepal.Length", Sepal.Length, Sepal.Length |
 #       .        , .        , "Sepal.Width" , "Sepal.Length", Sepal.Width , Sepal.Length |
 #       .        , .        , "Petal.Length", "Sepal.Length", Petal.Length, Sepal.Length |
 #       .        , .        , "Petal.Width" , "Sepal.Length", Petal.Width , Sepal.Length |
 #       .        , .        , "Sepal.Length", "Sepal.Width" , Sepal.Length, Sepal.Width  |
 #       .        , .        , "Sepal.Width" , "Sepal.Width" , Sepal.Width , Sepal.Width  |
 #       .        , .        , "Petal.Length", "Sepal.Width" , Petal.Length, Sepal.Width  |
 #       .        , .        , "Petal.Width" , "Sepal.Width" , Petal.Width , Sepal.Width  |
 #       .        , .        , "Sepal.Length", "Petal.Length", Sepal.Length, Petal.Length |
 #       .        , .        , "Sepal.Width" , "Petal.Length", Sepal.Width , Petal.Length |
 #       .        , .        , "Petal.Length", "Petal.Length", Petal.Length, Petal.Length |
 #       .        , .        , "Petal.Width" , "Petal.Length", Petal.Width , Petal.Length |
 #       .        , .        , "Sepal.Length", "Petal.Width" , Sepal.Length, Petal.Width  |
 #       .        , .        , "Sepal.Width" , "Petal.Width" , Sepal.Width , Petal.Width  |
 #       .        , .        , "Petal.Length", "Petal.Width" , Petal.Length, Petal.Width  |
 #       .        , .        , "Petal.Width" , "Petal.Width" , Petal.Width , Petal.Width  )
 #   block_keys <- c('iris_id', 'Species', 'v1', 'v2')
 #
 #   # args: c(checkNames = TRUE, checkKeys = FALSE, strict = FALSE, allow_rqdatatable = FALSE)
 #  }
The above is now wrapped into a one-line command in WVPlots.
The cdata package develops the idea of the “coordinatized data” theory and includes an implementation of the “fluid data” methodology.
The main cdata interfaces are given by the following set of methods:
rowrecs_to_blocks_spec(), for specifying how single row records map to general multi-row (or block) records.blocks_to_rowrecs_spec(), for specifying how multi-row block records map to single-row records.layout_specification(), for specifying transforms from multi-row records to other multi-row records.layout_by()or the wrapr dot arrow pipe for applying a layout to re-arrange data.t()(transpose/adjoint) to invert or reverse layout specifications.
Some convenience functions include:
pivot_to_rowrecs(), for moving data from multi-row block records with one value per row (a single column of values) to single-row recordsspreadordcast.pivot_to_blocks()/unpivot_to_blocks(), for moving data from single-row records to possibly multi row block records with one row per value (a single column of values)gatherormelt.wrapr::qchar_frame()a helper function for specifying record control table layout specifications.wrapr::build_frame()a helper function for specifying data frames.
The package vignettes can be found in the “Articles” tab of the cdata documentation site.
The (older) recommended tutorial is: Fluid data reshaping with cdata. We also have a (older) short free cdata screencast (and another example can be found here). These concepts were later adapted from cdata by the tidyr package.
Install via CRAN:
install.packages("cdata")
Note: cdata is targeted at data with “tame column names” (column names that are valid both in databases, and as R unquoted variable names) and basic types (column values that are simple R types such as character, numeric, logical, and so on).