Description
Cellular Automata.
Description
Create cellular automata from 'Wolfram' rules. Allows the creation of 'Wolfram' style plots, as well as of animations. Easy to create multiple plots, for example the output of a rule with different initial states, or the output of many different rules from the same state. The output of a cellular automaton is given as a matrix, making it easy to try to explore the possibility of predicting its time evolution using various statistical tools available in R. Wolfram S. (2002, ISBN:1579550088) "A New Kind of Science".
README.md
An R package for creating cellular automata.
library(cellularautomata)
Create the plot of a cellular automaton
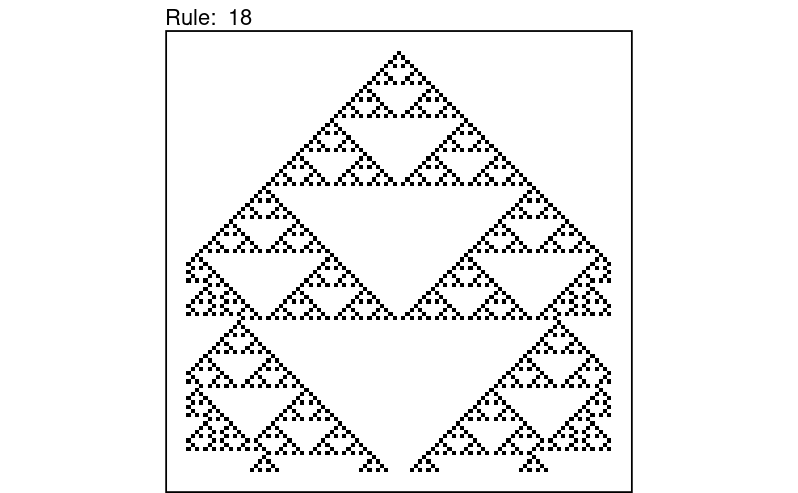
You can generate a cellular automaton using the ca function, specifying the Wolfram rule. For example:
ca(18) |> plot()
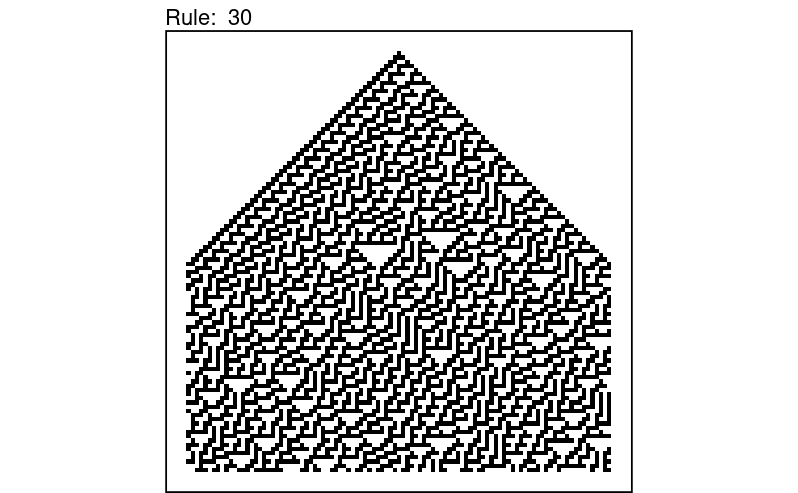
ca(30) |> plot()
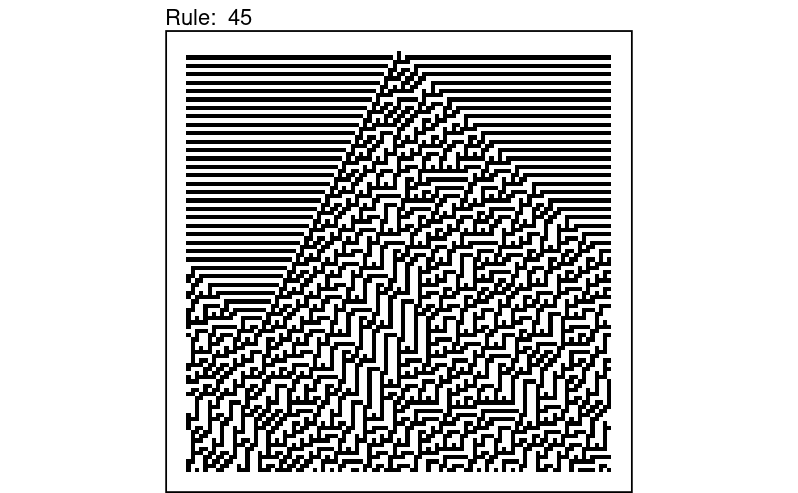
ca(45) |> plot()
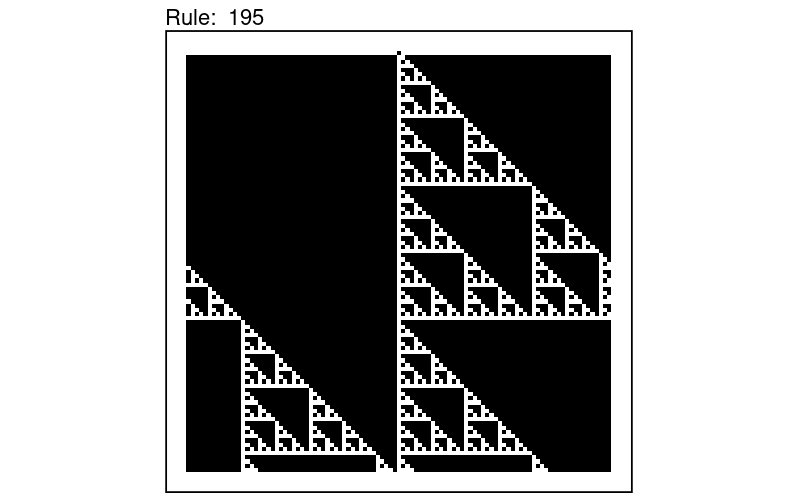
ca(195) |> plot()
Animations
You can get an animation of a cellular automaton using plot(animate = TRUE):
ca(30, ncols = 20, steps = 30) |> plot(animate = TRUE)
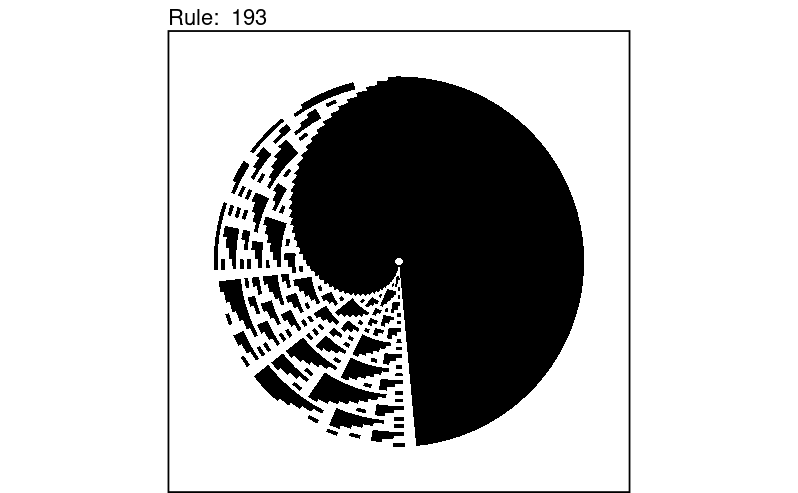
Polar coordinates
By default the line is wrapped, meaning it is actually a circle, with the end connected to the beginning.
You can plot it using polar coordinates:
ca(193, steps = 50) |> plot(time_flow = "up", circle = TRUE)
This also works for animations:
ca(193, ncols = 25, steps = 100) |> plot(circle = TRUE, animate = TRUE)
Acknowledgements
Original function created by Nicola Procopio.