Data from Japan Meteorological Agency.
clidatajp はじめに
The goal of clidatajp is to provide climate data from Japan Meteorological Agency (‘JMA’). Data was downloaded from ‘JMA’ and edited. You can also download climate data from ‘JMA’. However, I strongly recomend you to use data(climate_world) and data(climate_jp) when using mean temperature and precipitation.
clidatajpは,日本の気象庁(JMA)から取得した気候データを提供することを目的に開発しました. データは,気象庁のページから取得して編集したものです. また,気象庁から新たにデータをダウンロードすることも可能です.
Installation インストール
You can install the development version of clidatajp from GitHub. You can see climate data directly from ‘JMA’ ( https://www.data.jma.go.jp/gmd/cpd/monitor/nrmlist/ ).
開発中のバージョンは,GitHubからダウンロード可能です.
https://github.com/matutosi/clidatajp).
また,clidatajpを使わずとも,手作業で気象庁から直接データをダウンロードすることもできます.
https://www.data.jma.go.jp/gmd/cpd/monitor/nrmlist/
ただし,download_climate()や手作業で新たにデータを取得するには時間がかかります. そのため,月平均気温と月間降水量については,data(climate_world) と data(climate_jp)の使用をお勧めします.
  # CRAN
install.packages("clidatajp")

  # development
  # install.packages("devtools")
devtools::install_github("matutosi/clidatajp")
Example 使用例
This is a basic example.
基本的な使い方は以下をご覧ください.
library(clidatajp)
library(magrittr)
library(dplyr)
#>
#> Attaching package: 'dplyr'
#> The following objects are masked from 'package:stats':
#>
#> filter, lag
#> The following objects are masked from 'package:base':
#>
#> intersect, setdiff, setequal, union
library(tibble)
library(ggplot2)
library(stringi)
# show station information and link
# 観測地点とそのリンクのデータ
data(station_links)
station_links %>%
dplyr::mutate("station" := stringi::stri_unescape_unicode(station))
#> # A tibble: 3,444 × 4
#> no station url conti…¹
#> <chr> <chr> <chr> <chr>
#> 1 60560 アインセフラ - アルジェリア 緯度:32.77°N 経度:0.6… https… "\\u30…
#> 2 60620 アドラル - アルジェリア 緯度:27.88°N 経度:0.18°W… https… "\\u30…
#> 3 60369 アルジェ - アルジェリア 緯度:36.77°N 経度:3.10°E… https… "\\u30…
#> 4 60360 アンナバ - アルジェリア 緯度:36.83°N 経度:7.82°E… https… "\\u30…
#> 5 60611 イナメナス - アルジェリア 緯度:28.05°N 経度:9.63… https… "\\u30…
#> 6 60640 イリジ - アルジェリア 緯度:26.50°N 経度:8.42°E … https… "\\u30…
#> 7 60690 インゲザム - アルジェリア 緯度:19.57°N 経度:5.77… https… "\\u30…
#> 8 60630 インサラー - アルジェリア 緯度:27.23°N 経度:2.50… https… "\\u30…
#> 9 60559 ウェド - アルジェリア 緯度:33.50°N 経度:6.78°E … https… "\\u30…
#> 10 60421 ウームエルブワギー - アルジェリア 緯度:35.87°N 経… https… "\\u30…
#> # … with 3,434 more rows, and abbreviated variable name ¹continent
# show climate data
# 観測データ(日本,世界)
data(japan_climate)
japan_climate %>%
dplyr::mutate_if(is.character, stringi::stri_unescape_unicode)
#> # A tibble: 3,768 × 14
#> no station month temperat…¹ preci…² snowf…³ insol…⁴ country period altit…⁵
#> <dbl> <chr> <dbl> <dbl> <dbl> <dbl> <dbl> <chr> <chr> <dbl>
#> 1 47401 稚内 1 -4.3 84.6 129 40.6 日本 1991-… 2.8
#> 2 47401 稚内 2 -4.3 60.6 105 74.7 日本 1991-… 2.8
#> 3 47401 稚内 3 -0.6 55.1 68 138. 日本 1991-… 2.8
#> 4 47401 稚内 4 4.5 50.3 9 174. 日本 1991-… 2.8
#> 5 47401 稚内 5 9.1 68.1 0 182. 日本 1991-… 2.8
#> 6 47401 稚内 6 13 65.8 NA 155. 日本 1991-… 2.8
#> 7 47401 稚内 7 17.2 101. NA 143. 日本 1991-… 2.8
#> 8 47401 稚内 8 19.5 123. NA 151. 日本 1991-… 2.8
#> 9 47401 稚内 9 17.2 137. NA 172. 日本 1991-… 2.8
#> 10 47401 稚内 10 11.3 130. 1 135. 日本 1991-… 2.8
#> # … with 3,758 more rows, 4 more variables: latitude <dbl>, longitude <dbl>,
#> # NS <chr>, WE <chr>, and abbreviated variable names ¹temperature,
#> # ²precipitation, ³snowfall, ⁴insolation, ⁵altitude
data(climate_world)
climate_world %>%
dplyr::mutate_if(is.character, stringi::stri_unescape_unicode)
#> # A tibble: 41,328 × 12
#> no continent country station month tempe…¹ preci…² latit…³ NS longi…⁴
#> <dbl> <chr> <chr> <chr> <dbl> <dbl> <dbl> <dbl> <chr> <dbl>
#> 1 60560 アフリカ アルジェ… アイン… 1 7.1 14.9 32.8 N 0.6
#> 2 60560 アフリカ アルジェ… アイン… 2 9.2 11.2 32.8 N 0.6
#> 3 60560 アフリカ アルジェ… アイン… 3 12.9 15.9 32.8 N 0.6
#> 4 60560 アフリカ アルジェ… アイン… 4 16.8 16.9 32.8 N 0.6
#> 5 60560 アフリカ アルジェ… アイン… 5 21.5 15 32.8 N 0.6
#> 6 60560 アフリカ アルジェ… アイン… 6 26.7 6.9 32.8 N 0.6
#> 7 60560 アフリカ アルジェ… アイン… 7 31 4.1 32.8 N 0.6
#> 8 60560 アフリカ アルジェ… アイン… 8 29.5 13.5 32.8 N 0.6
#> 9 60560 アフリカ アルジェ… アイン… 9 24.4 21 32.8 N 0.6
#> 10 60560 アフリカ アルジェ… アイン… 10 18.6 25.8 32.8 N 0.6
#> # … with 41,318 more rows, 2 more variables: WE <chr>, altitude <dbl>, and
#> # abbreviated variable names ¹temperature, ²precipitation, ³latitude,
#> # ⁴longitude
# download climate data
# 新たにデータを取得する場合
station_links %>%
`$`("url") %>%
`[[`(1) %>%
download_climate()
#> # A tibble: 12 × 11
#> station country latit…¹ NS longi…² WE altit…³ month tempe…⁴ preci…⁵
#> <chr> <chr> <chr> <chr> <chr> <chr> <chr> <dbl> <dbl> <dbl>
#> 1 アインセフ… アルジ… 32.77 N 0.60 W 1058 1 7.1 14.9
#> 2 アインセフ… アルジ… 32.77 N 0.60 W 1058 2 9.2 11.2
#> 3 アインセフ… アルジ… 32.77 N 0.60 W 1058 3 12.9 15.9
#> 4 アインセフ… アルジ… 32.77 N 0.60 W 1058 4 16.8 16.9
#> 5 アインセフ… アルジ… 32.77 N 0.60 W 1058 5 21.5 15
#> 6 アインセフ… アルジ… 32.77 N 0.60 W 1058 6 26.7 6.9
#> 7 アインセフ… アルジ… 32.77 N 0.60 W 1058 7 31 4.1
#> 8 アインセフ… アルジ… 32.77 N 0.60 W 1058 8 29.5 13.5
#> 9 アインセフ… アルジ… 32.77 N 0.60 W 1058 9 24.4 21
#> 10 アインセフ… アルジ… 32.77 N 0.60 W 1058 10 18.6 25.8
#> 11 アインセフ… アルジ… 32.77 N 0.60 W 1058 11 12 22.3
#> 12 アインセフ… アルジ… 32.77 N 0.60 W 1058 12 8.2 9.4
#> # … with 1 more variable: url <chr>, and abbreviated variable names ¹latitude,
#> # ²longitude, ³altitude, ⁴temperature, ⁵precipitation
Plot 図示
Clean up data before drawing plot.
図化前のデータ整理
- 世界と日本のデータを結合
- 気温と降水量がNAの地点を除去
- 1991-2020の平年値を使用(日本)
- 緯度経度を整理
climate <-
  dplyr::bind_rows(climate_world, climate_jp) %>%
  dplyr::mutate_if(is.character, stringi::stri_unescape_unicode)  %>%
  dplyr::group_by(country, station) %>%
  dplyr::filter(sum(is.na(temperature), is.na(precipitation)) == 0) %>%
  dplyr::filter(period != "1991-2020" | is.na(period))

climate <-
  climate %>%
  dplyr::summarise(temp = mean(as.numeric(temperature)), prec = sum(as.numeric(precipitation))) %>%
  dplyr::left_join(dplyr::distinct(dplyr::select(climate, station:altitude))) %>%
  dplyr::left_join(tibble::tibble(NS = c("S", "N"), ns = c(-1, 1))) %>%
  dplyr::left_join(tibble::tibble(WE = c("W", "E"), we = c(-1, 1))) %>%
  dplyr::group_by(station) %>%
  dplyr::mutate(lat = latitude * ns, lon = longitude * we)
#> `summarise()` has grouped output by 'country'. You can override using the
#> `.groups` argument.
#> Adding missing grouping variables: `country`
#> Joining with `by = join_by(country, station)`
#> Warning in dplyr::left_join(., dplyr::distinct(dplyr::select(climate, station:altitude))): Each row in `x` is expected to match at most 1 row in `y`.
#> ℹ Row 1 of `x` matches multiple rows.
#> ℹ If multiple matches are expected, set `multiple = "all"` to silence this
#>   warning.
#> Joining with `by = join_by(NS)`
#> Joining with `by = join_by(WE)`
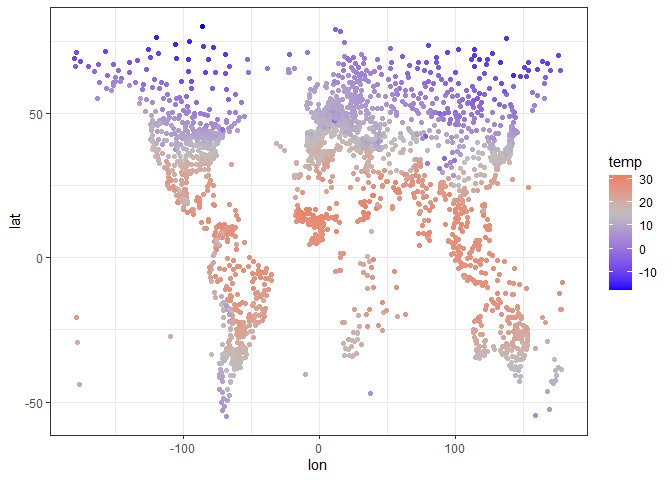
Draw a world map with temperature.
年平均気温を世界地図のように表示. ただし,緯度経度は単純な数値のため,正確ではない.
climate %>%
  ggplot2::ggplot(aes(lon, lat, colour = temp)) +
    scale_colour_gradient2(low = "blue", mid = "gray", high = "red", midpoint = 15) +
    geom_point() +
    theme_bw()
# ggsave("temperature.png")
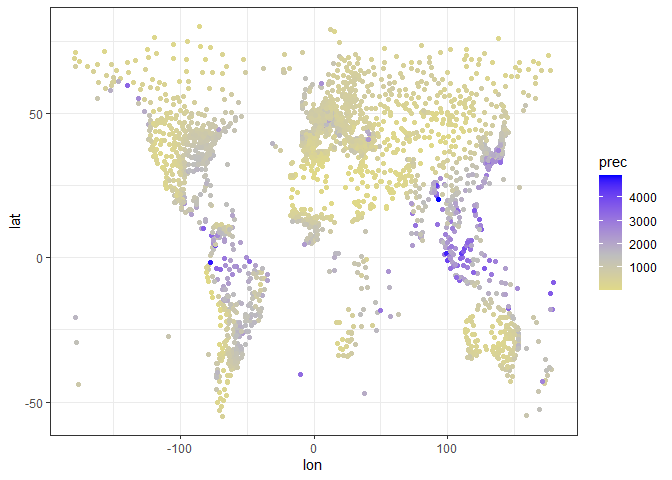
Draw a world map with precipitation except over 5000 mm/yr (to avoid extended legend).
年間降水量を世界地図のように表示. ただし,凡例が引きずられるのを防ぐため,5000mm/年 以上の地点は除去.
climate %>%
  dplyr::filter(prec < 5000) %>%
  ggplot2::ggplot(aes(lon, lat, colour = prec)) +
    scale_colour_gradient2(low = "yellow", mid = "gray", high = "blue", midpoint = 1500) +
    geom_point() +
    theme_bw()
# ggsave("precipitation.png")
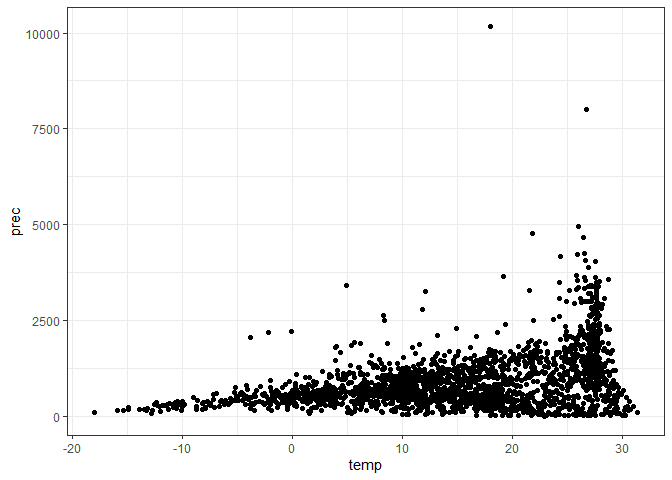
Show relationships between temperature and precipitation except Japan.
気温と降水量の関係(日本は除外)
japan <- stringi::stri_unescape_unicode("\\u65e5\\u672c")
climate %>%
  dplyr::filter(country != japan) %>%
  ggplot2::ggplot(aes(temp, prec)) +
  geom_point() +
  theme_bw() +
  theme(legend.position="none")
# ggsave("climate_nojp.png")
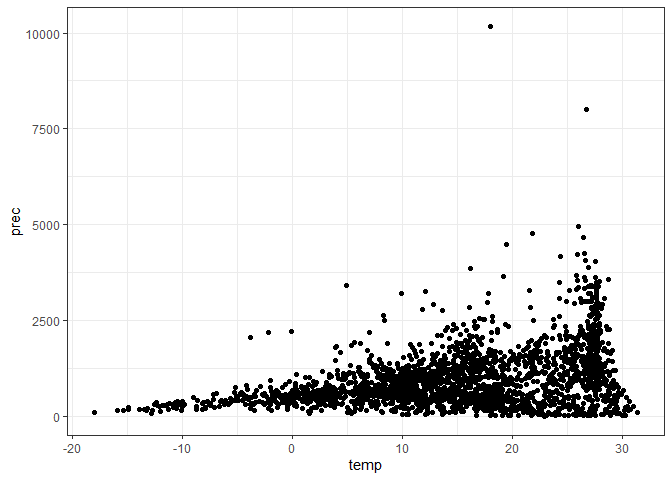
Show relationships between temperature and precipitation including Japan.
気温と降水量の関係(日本を含む)
climate %>%
  ggplot2::ggplot(aes(temp, prec)) +
    geom_point() +
    theme_bw()
# ggsave("climate_all.png")
Show relationships between temperature and precipitation. Blue: Japan, red: others.
気温と降水量の関係(日本:水色,日本以外:赤色)
climate %>%
  dplyr::mutate(jp = (country == japan)) %>%
  ggplot2::ggplot(aes(temp, prec, colour = jp)) +
    geom_point() +
    theme_bw() +
    theme(legend.position="none")
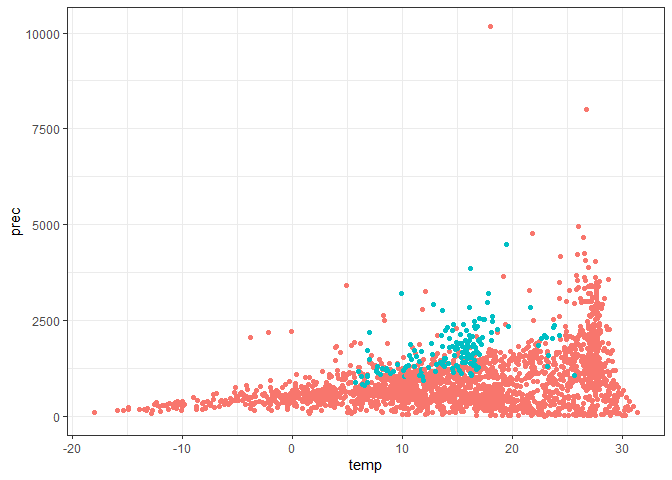
# ggsave("climate_compare_jp.png")
Citation 引用
Toshikazu Matsumura (2022) Tools for download climate data from Japan Meteorological Agency with R. https://github.com/matutosi/clidatajp/.
松村 俊和 (2022) Rを使った気象庁からの観測データの取得ツール. https://github.com/matutosi/clidatajp/ .