Generate Cofeature Matrices.
cofeatureR
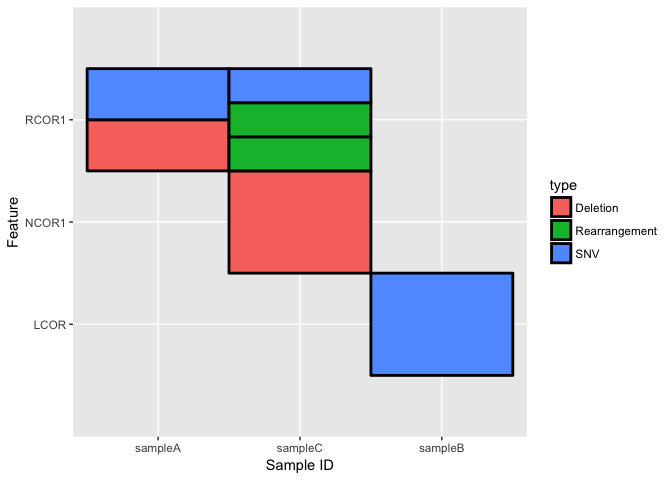
cofeatureR is an R Package that provides functions for plotting cofeature matrices (aka. feature-sample matrices). For example:

Installation
To get the released version from CRAN:
install.packages("cofeatureR")
You can also get cofeatureR through conda:
conda install -c fongchun r-cofeaturer
To install the latest developmental version from github:
devtools::install_github("tinyheero/cofeatureR")
How to Use
The main function of cofeatureR is the plot_cofeature_mat function. It will produce a matrix plot (feature x sample) showing how the different “types” correlate between samples and features. This function only has one required input which is a data.frame containing 3 columns:
- feature: Feature name
- sampleID: Sample name
- type: Type associated with the feature-sample.
For instance in the field of cancer genomics, we are often interested in knowing how different mutations (type) in different samples (sampleID) correlate between genes (feature). The input data.frame would have this format:
library("cofeatureR")
v1 <- c("RCOR1", "NCOR1", "LCOR", "RCOR1", "RCOR1", "RCOR1", "RCOR1")
v2 <- c("sampleA", "sampleC", "sampleB", "sampleC", "sampleA", "sampleC", "sampleC")
v3 <- c("Deletion", "Deletion", "SNV", "Rearrangement", "SNV", "Rearrangement", "SNV")

in.df <- dplyr::data_frame(feature = v1, sampleID = v2, type = v3)
knitr::kable(in.df)
| feature | sampleID | type |
|---|---|---|
| RCOR1 | sampleA | Deletion |
| NCOR1 | sampleC | Deletion |
| LCOR | sampleB | SNV |
| RCOR1 | sampleC | Rearrangement |
| RCOR1 | sampleA | SNV |
| RCOR1 | sampleC | Rearrangement |
| RCOR1 | sampleC | SNV |
This input data.frame can now be used as input into plot_cofeature_mat:
plot_cofeature_mat(in.df, tile.col = "black")

Notice how we are NOT restricted to having only one type per feature-sample. In other words, a feature-sample may have multiple types and plot_cofeature_mat will display all of the types.
There are many different parameters that can be passed into the plot_cofeature_mat for customization of the plot. For instance:
fill.colors: Custom colors for each type.feature.orderandsample.id.order: Custom ordering of features and samples respectively.tile.col: Add borders around each type.
Citing cofeatureR
#> Warning in citation(package = "cofeatureR"): no date field in DESCRIPTION
#> file of package 'cofeatureR'
#> Warning in citation(package = "cofeatureR"): could not determine year for
#> 'cofeatureR' from package DESCRIPTION file
To cite package ‘cofeatureR’ in publications use:
Fong Chun Chan (NA). cofeatureR: Generate Cofeature Matrices. R package version 1.1.0. https://github.com/tinyheero/cofeatureR
A BibTeX entry for LaTeX users is
@Manual{, title = {cofeatureR: Generate Cofeature Matrices}, author = {Fong Chun Chan}, note = {R package version 1.1.0}, url = {https://github.com/tinyheero/cofeatureR}, }
