Use 'GeoArrow' to Add 'Deck.gl' Layers to a 'maplibregl'/'mapboxgl' Map.
deckglgeoarrow

About
Easy and efficient rendering of very large geospatial data in the browser.
deckglgeoarrow provides functionality to efficiently visualise potentially very large geospatial data as Deck.gl layers on top of a maplibre/mapbox map created with package mapgl.
For very quick and efficient data transfer from R memory to the browser, geoarrowWidget is used. Layer creation is done in ‘JavaScript’ using geoarrow/deck.gl-geoarrow (see Features section for details on how and why layer creation is efficient).
Features
Currently, (MULTI)POINT, (MULTI)LINESTRING and (MULTI)POLYGON features are supported by the following layer functions:
addGeoarrowScatterplotLayerfor point dataaddGeoarrowPathLayerfor linestring dataaddGeoarrowPolygonLayerfor polygon data
Support for other layers, such as discrete global grid layers (S2, A5, H3), origin-destination layers (Arc, trips) and point-cloud layers, among others, will follow.
Supported data sources
R
Spatial classes from the following R packages are supported (via data argument):
Others
The following local or remotely hosted files types are supported (via file/url argument):
Note, that due to a restriction in the upstream JavaScript dependency, only files with native GeoArrow geometry encoding are supported. WKB encoded geometries will not render!
In addition, nanoarrowarray_streams (as files) are supported.
Installation
The development version of deckglgeoarrow can be installed from GitHub with:
# install.packages("pak")
pak::pak("r-spatial/deckglgeoarrow")
Example
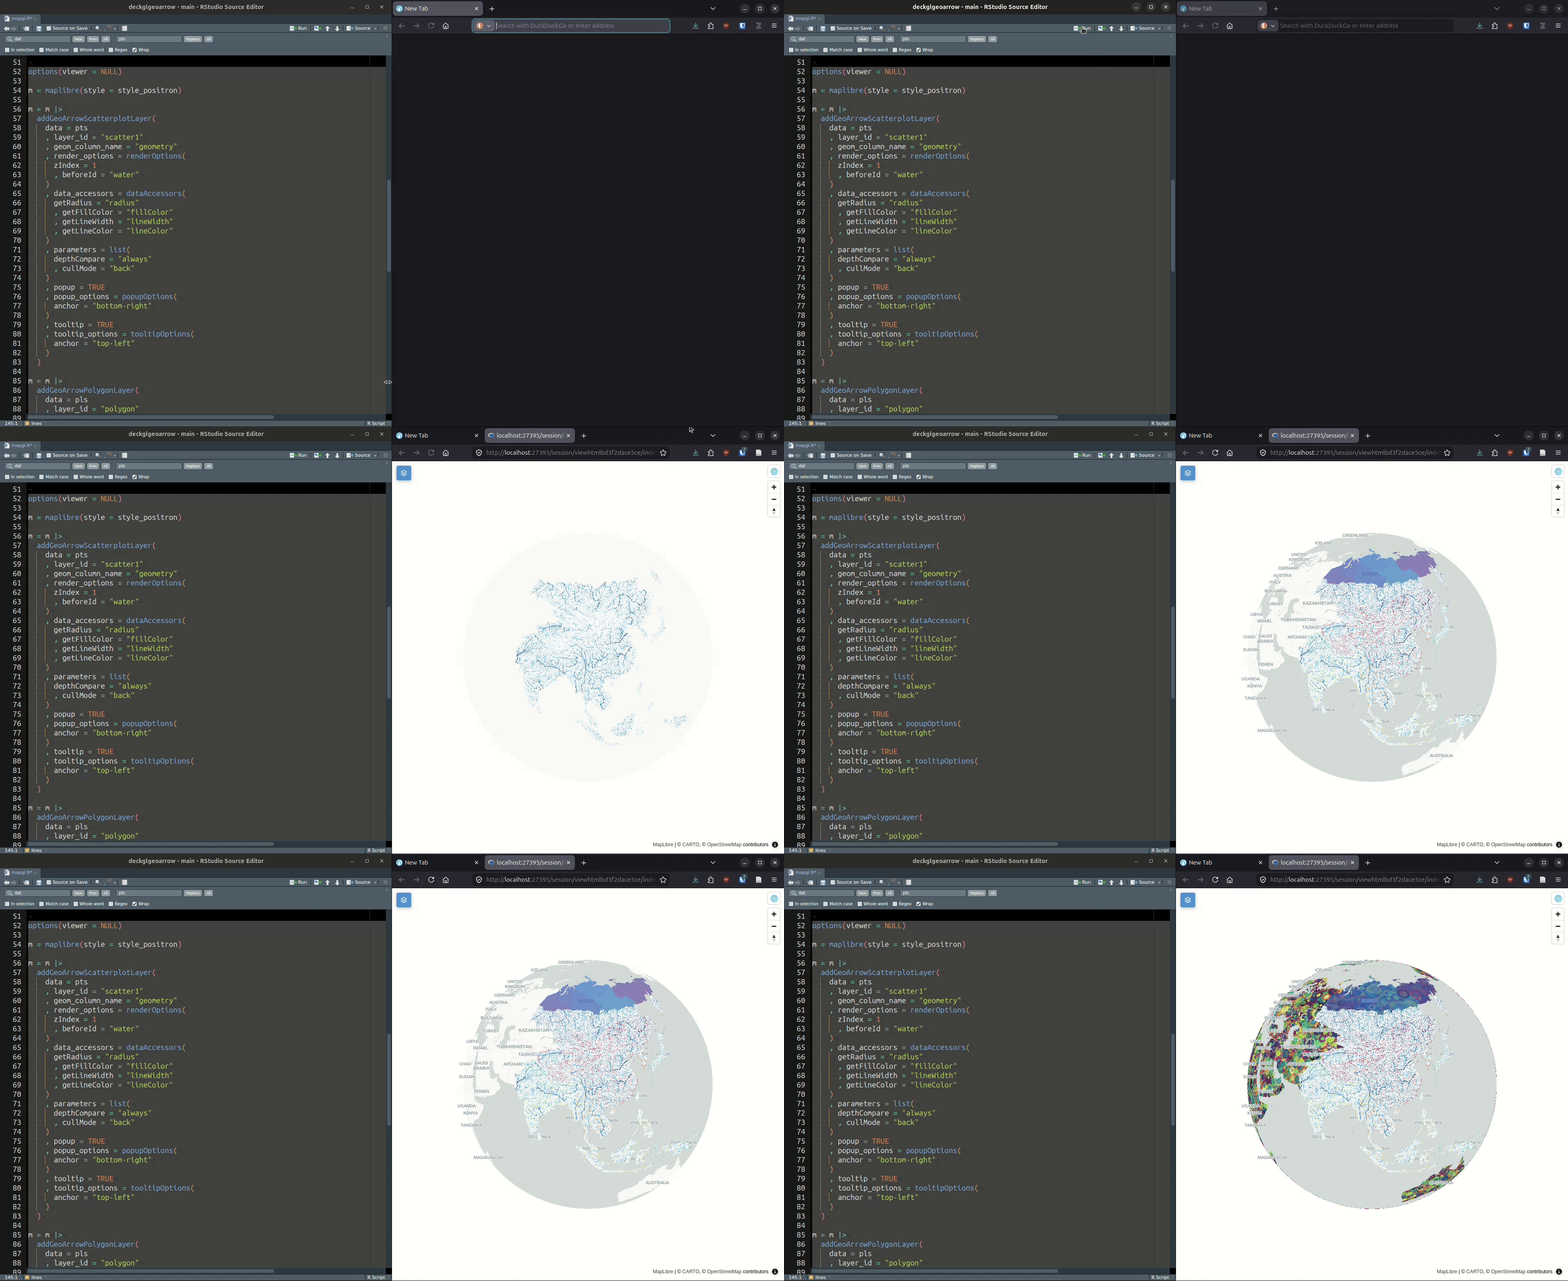
To showcase what the package can do, consider this example.
Here, we visualise
- 1M random points with random sizes and colors +
- ~11k polygons colored by river basin +
- ~155k lines colored and sized according to their Strahler number
in one map.
Here’s how quickly this renders:
More examples can be found here
Acknowledgment
This project has been realized with financial support from the.