Supervised Generalized Association Plots Based on Decision Trees.
dtGAP
Supervised Generalized Association Plots Based on Decision Trees
Decision trees are prized for their simplicity and interpretability but often fail to reveal underlying data structures. Generalized Association Plots (GAP) excel at illustrating complex associations yet are typically unsupervised. dtGAP bridges this gap by embedding supervised correlation and distance measures into GAP for enriched decision-tree visualization, offering confusion matrix maps, decision-tree matrix maps, predicted class membership maps, and evaluation panels.
Installation
# Install from CRAN
install.packages("dtGAP")

# Or install the development version from GitHub
# install.packages("devtools")
devtools::install_github("hanmingwu1103/dtGAP")
Quick Start
library(dtGAP)
penguins <- na.omit(penguins)
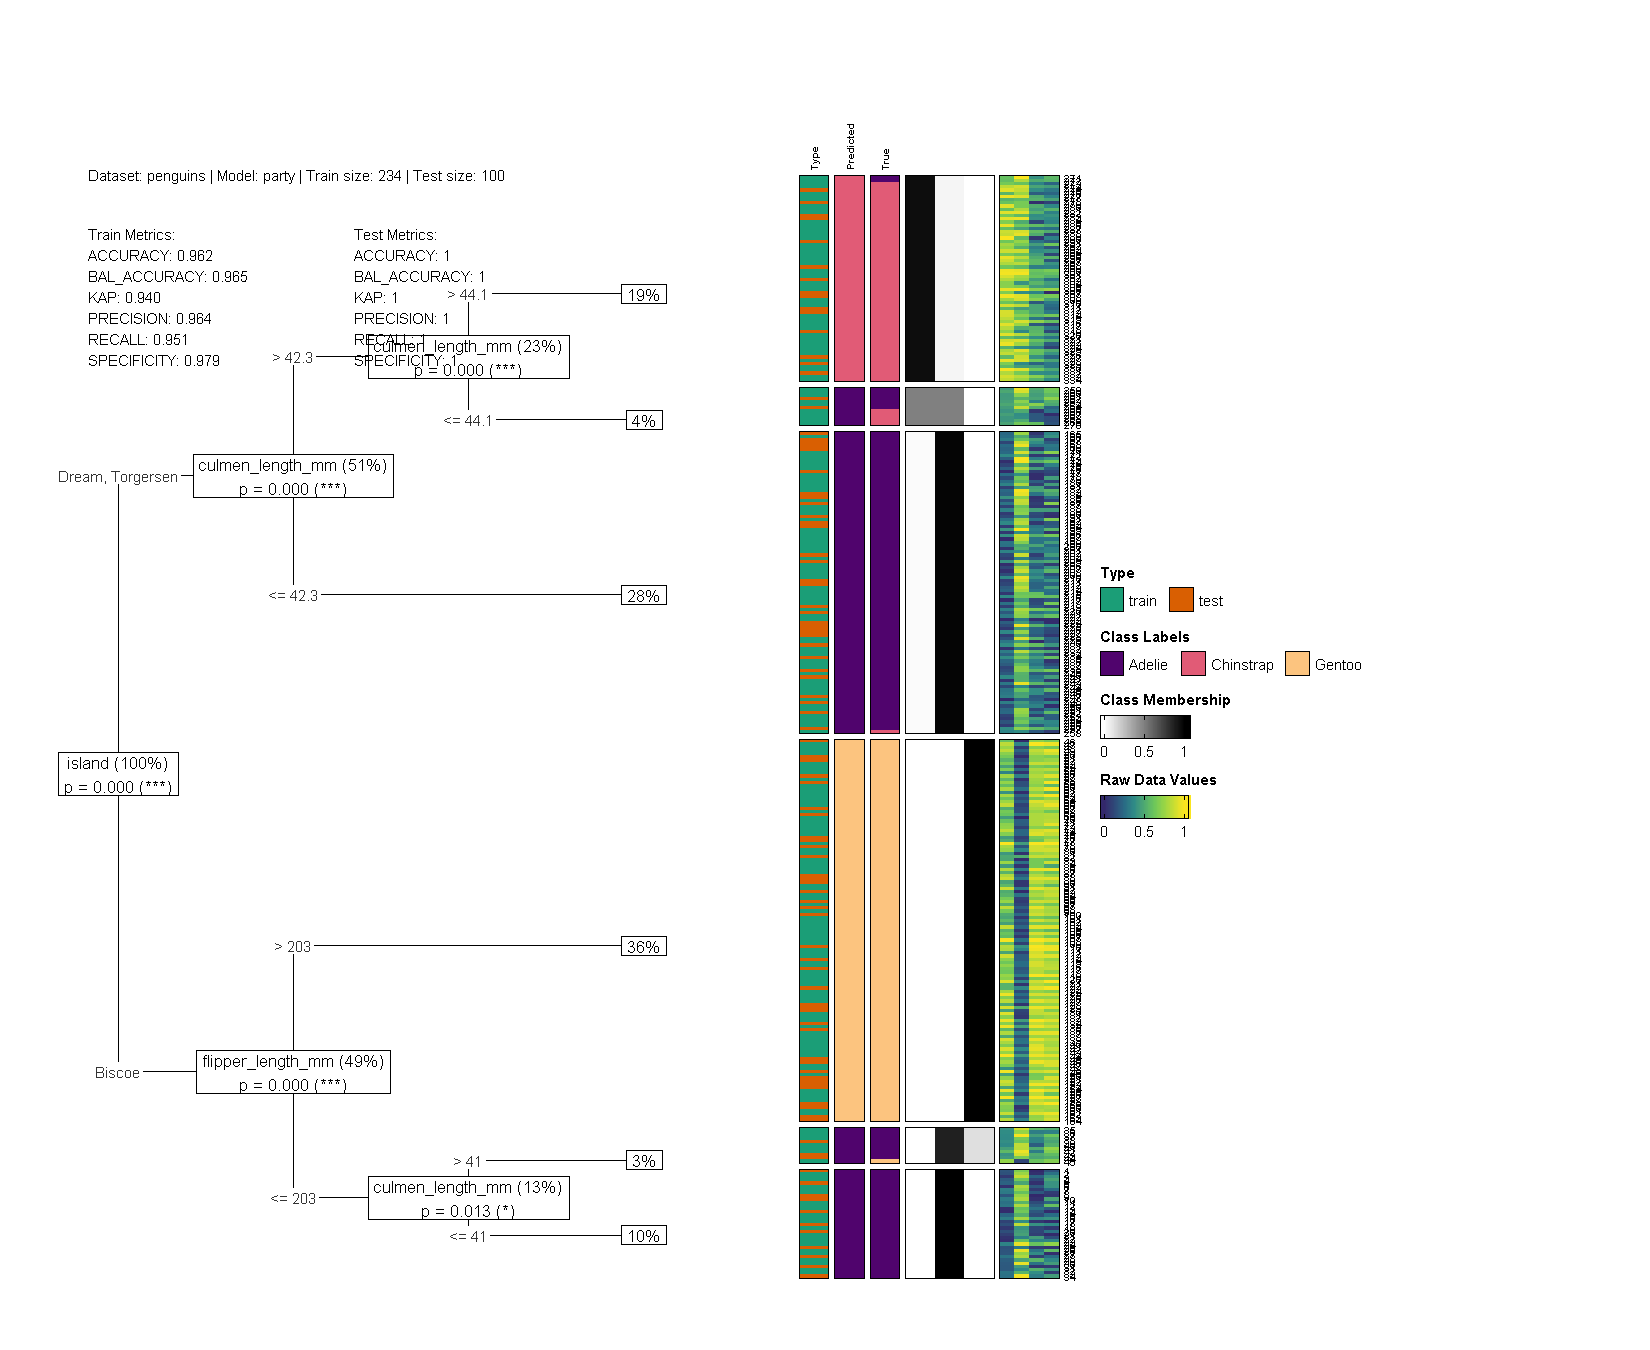
dtGAP(
data_all = penguins, model = "party", show = "all",
trans_type = "percentize", target_lab = "species",
simple_metrics = TRUE,
label_map_colors = c(
"Adelie" = "#50046d", "Gentoo" = "#fcc47f",
"Chinstrap" = "#e15b76"
),
show_col_prox = FALSE, show_row_prox = FALSE,
raw_value_col = colorRampPalette(
c("#33286b", "#26828e", "#75d054", "#fae51f")
)(9)
)
Features
Tree Models
Choose between two tree models via the model argument:
"rpart"(classic CART): Each node shows class-membership probabilities and the percentage of samples in each branch."party"(conditional inference trees): Each internal node is annotated with its split-variable p-value and the percentage of samples in each branch.
Data Subsets
Control which data to visualize with the show argument: "all", "train", or "test".
Row and Column Proximity
- Column Proximity: Combined conditional correlation matrix weighted by group memberships.
- Row Proximity: Supervised distance combining within-leaf dispersion and between-leaf separation using linkage
"CT"(centroid),"SG"(single), or"CP"(complete).
Use any method from the seriation package to reorder rows and columns. The cRGAR score quantifies order quality (near 0 = good sorting, near 1 = many violations).
Data Transformation
Choose a suitable transformation via trans_type: "none", "percentize", "normalize", or "scale".
Evaluation Metrics
When print_eval = TRUE, an evaluation panel shows:
- Data Information: Dataset name, model, train/test sizes, proximity method, linkage, seriation algorithm, and cRGAR score.
- Train/Test Metrics:
- Full confusion-matrix report (default, via
caret::confusionMatrix()) - Simple metrics (
simple_metrics = TRUE): Accuracy, Balanced Accuracy, Kappa, Precision, Recall, Specificity
- Full confusion-matrix report (default, via
Train/Test Workflow
dtGAP(
  data_train = train_covid, data_test = test_covid,
  target_lab = "Outcome", show = "test",
  label_map = c("0" = "Survival", "1" = "Death"),
  label_map_colors = c("Survival" = "#50046d", "Death" = "#fcc47f"),
  simple_metrics = TRUE
)
Regression
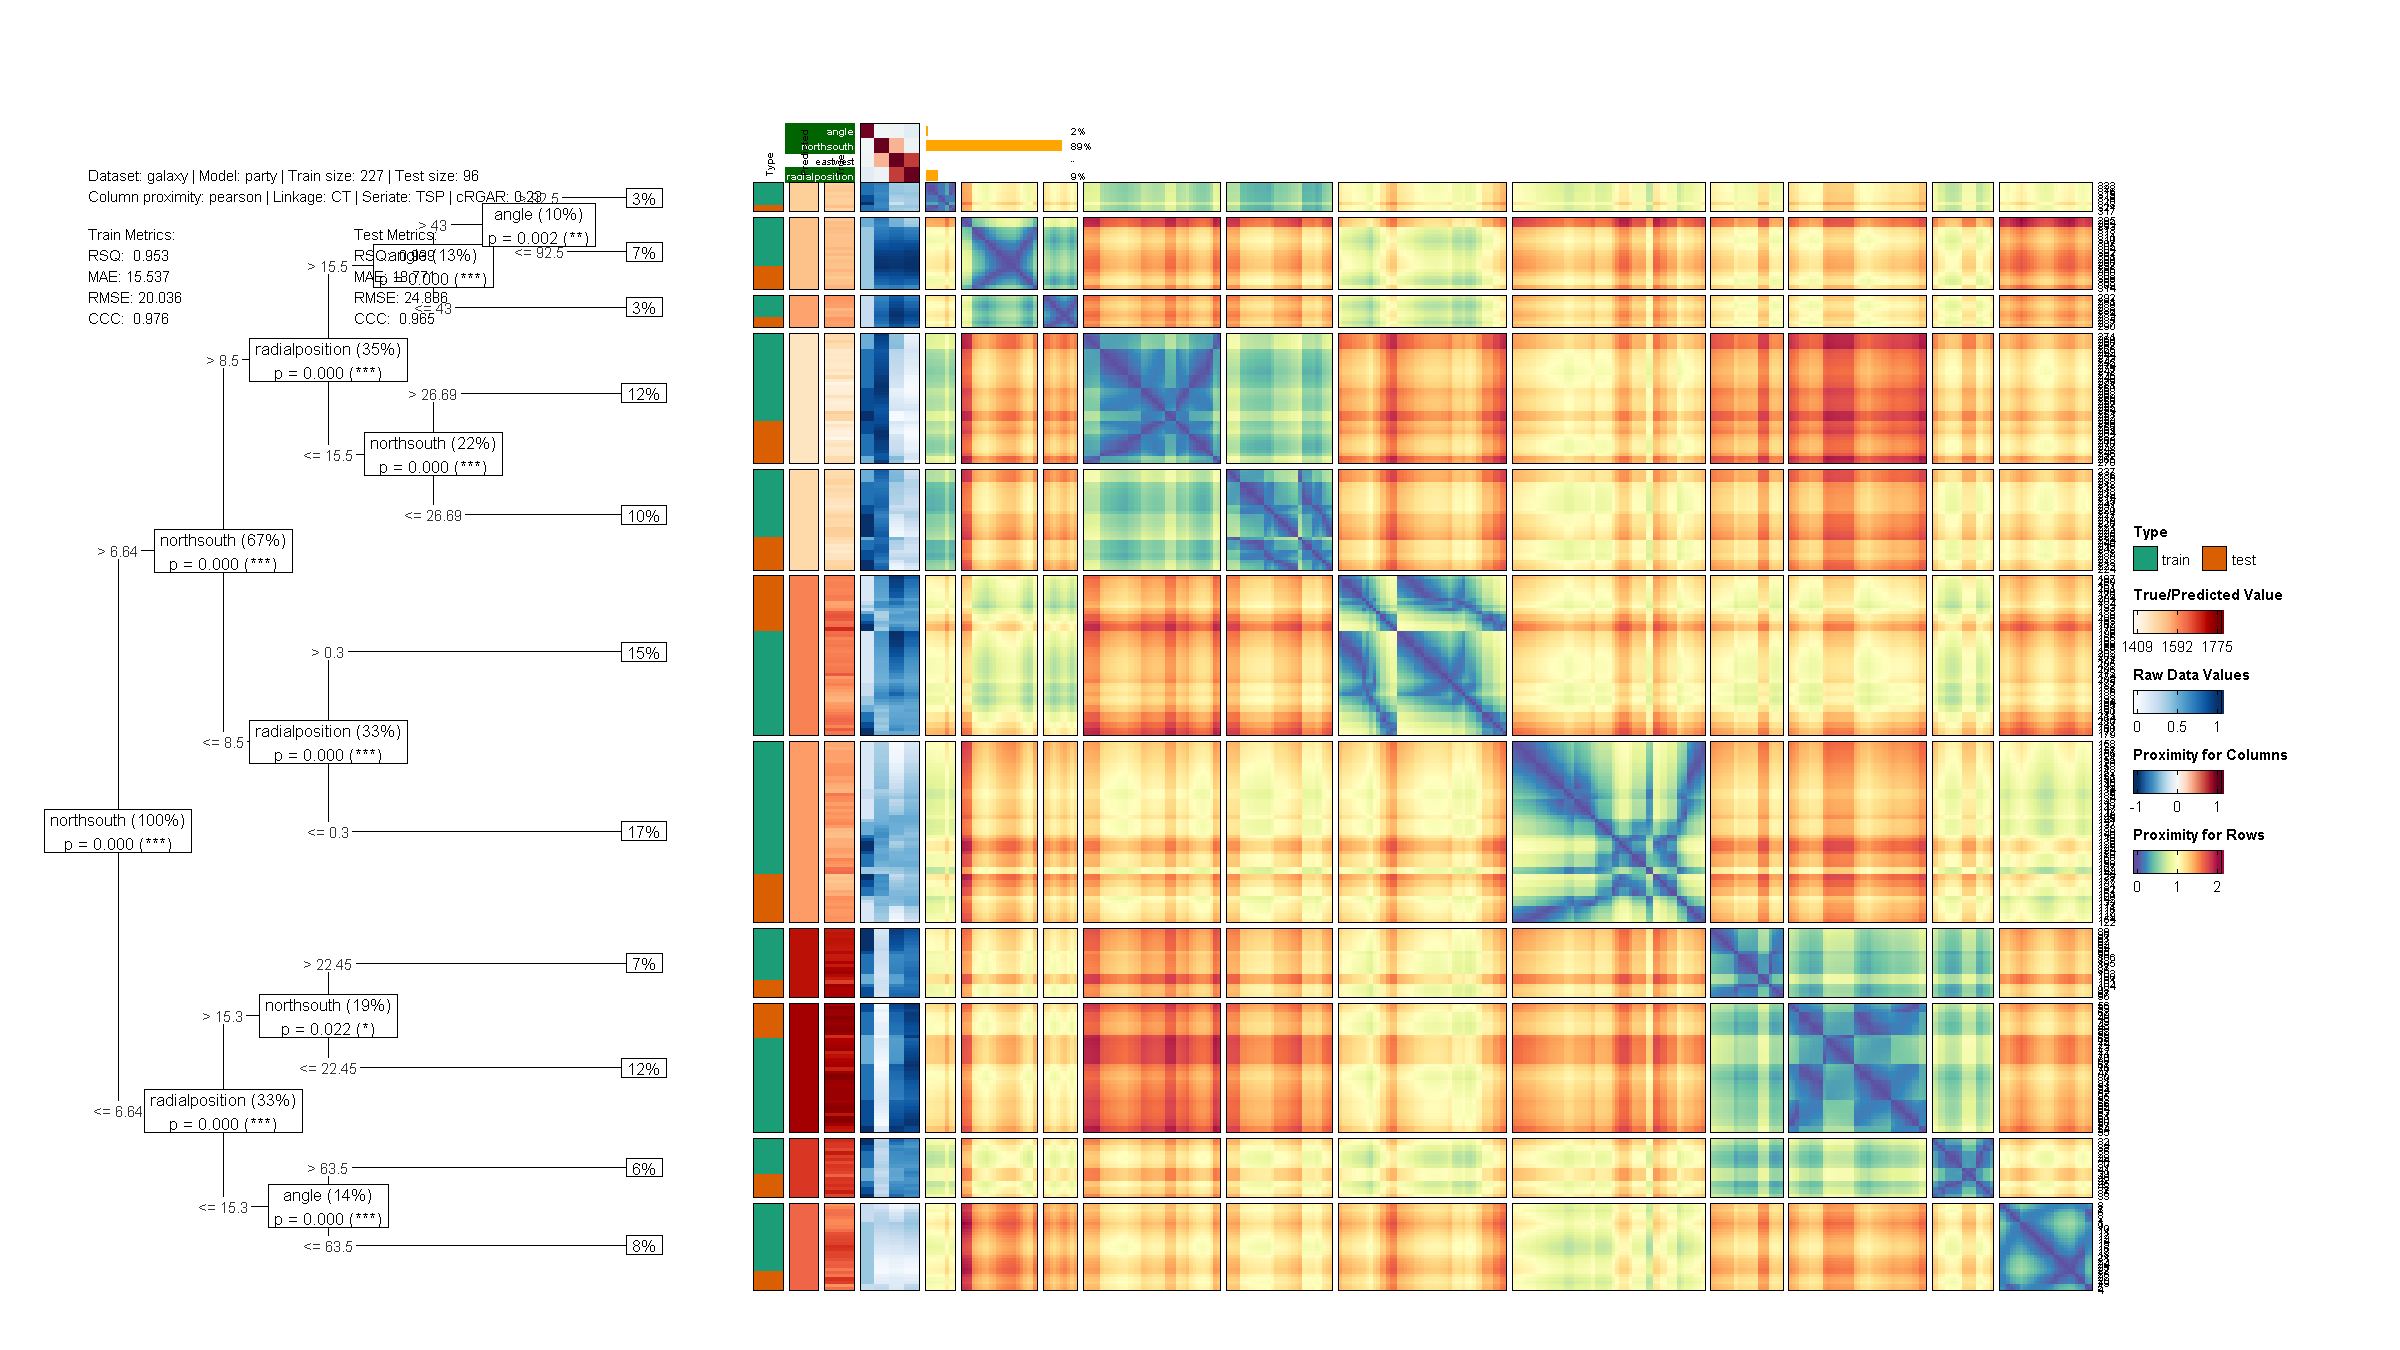
dtGAP also supports regression tasks with metrics including R-squared, MAE, RMSE, and CCC:
dtGAP(
  data_all = galaxy, task = "regression",
  target_lab = "target", show = "all",
  trans_type = "percentize", model = "party",
  simple_metrics = TRUE
)
Variable Selection
Focus the heatmap on a subset of features while the tree is still trained on all variables:
dtGAP(
  data_train = train_covid, data_test = test_covid,
  target_lab = "Outcome", show = "test",
  select_vars = c("LDH", "Lymphocyte")
)
Custom Tree Input
Pass a pre-trained tree directly via the fit parameter. Supports rpart, party, and train (caret) objects with automatic model detection:
library(rpart)
custom_tree <- rpart(Outcome ~ ., data = train_covid)

dtGAP(
  fit = custom_tree,
  data_train = train_covid, data_test = test_covid,
  target_lab = "Outcome", show = "test"
)
Interactive Visualization
Set interactive = TRUE to launch a Shiny-based heatmap viewer powered by InteractiveComplexHeatmap:
dtGAP(
  data_train = train_covid, data_test = test_covid,
  target_lab = "Outcome", show = "test",
  interactive = TRUE
)
Multi-Model Comparison
Compare two or more tree models side-by-side with compare_dtGAP():
compare_dtGAP(
  models = c("rpart", "party"),
  data_train = train_covid, data_test = test_covid,
  target_lab = "Outcome", show = "test"
)
Random Forest Extension
Visualize conditional random forests via partykit::cforest:
# Ensemble summary: variable importance + representative tree
result <- rf_summary(
  data_train = train_covid, data_test = test_covid,
  target_lab = "Outcome", ntree = 50
)

# Visualize a single tree from the forest
rf_dtGAP(
  data_train = train_covid, data_test = test_covid,
  target_lab = "Outcome", show = "test",
  tree_index = result$rep_tree_index, ntree = 50
)
Export Plots
Save visualizations to PNG, PDF, or SVG:
save_dtGAP(
  file = "my_plot.png",
  data_train = train_covid, data_test = test_covid,
  target_lab = "Outcome", show = "test"
)
Customization
- Variable importance:
col_var_imp,var_imp_bar_width,var_imp_fontsize - Split variable labels:
split_var_bg,split_var_fontsize - Color palettes (any
RColorBrewerpalette):Col_Prox_palette/Col_Prox_n_colorsRow_Prox_palette/Row_Prox_n_colorssorted_dat_palette/sorted_dat_n_colors
- Label mapping:
label_map,label_map_colors - Proximity display:
show_row_prox,show_col_prox - Layout:
tree_pcontrols the proportion of canvas allocated to the tree
Included Datasets
| Dataset | Description | Observations | Task |
|---|---|---|---|
Psychosis_Disorder | SAPS/SANS symptom ratings | 95 | Classification |
penguins | Palmer penguins morphometrics | 344 | Classification |
wine | Italian wine chemical analysis | 178 | Classification |
diabetes | Pima Indians diabetes | 768 | Classification |
train_covid / test_covid | Wuhan COVID-19 patient records | 375 / 110 | Classification |
wine_quality_red | Portuguese red wine quality | 1599 | Regression |
galaxy | Galaxy velocity data | 323 | Regression |
Citation
Wu, H.-M., Chang, C.-Y., & Chen, C.-H. (2025). dtGAP: Supervised matrix visualization for decision trees based on the GAP framework. R package version 0.0.2. https://CRAN.R-project.org/package=dtGAP
References
- Chen, C. H. (2002). Generalized association plots: Information visualization via iteratively generated correlation matrices. Statistica Sinica, 12, 7-29.
- Le, T. T., & Moore, J. H. (2021). Treeheatr: An R package for interpretable decision tree visualizations. Bioinformatics, 37(2), 282-284.
- Wu, H. M., Tien, Y. J., & Chen, C. H. (2010). GAP: A graphical environment for matrix visualization and cluster analysis. Computational Statistics & Data Analysis, 54(3), 767-778.
License
MIT.