Description
Create Interactive Graphs with 'Echarts JavaScript' Version 6.
Description
Easily create interactive charts by leveraging the 'Echarts Javascript' library which includes 36 chart types, themes, 'Shiny' proxies and animations.
README.md


Note
The Github version just underwent a change from ECharts.js version 4 to version 6. Please use the stable CRAN version.
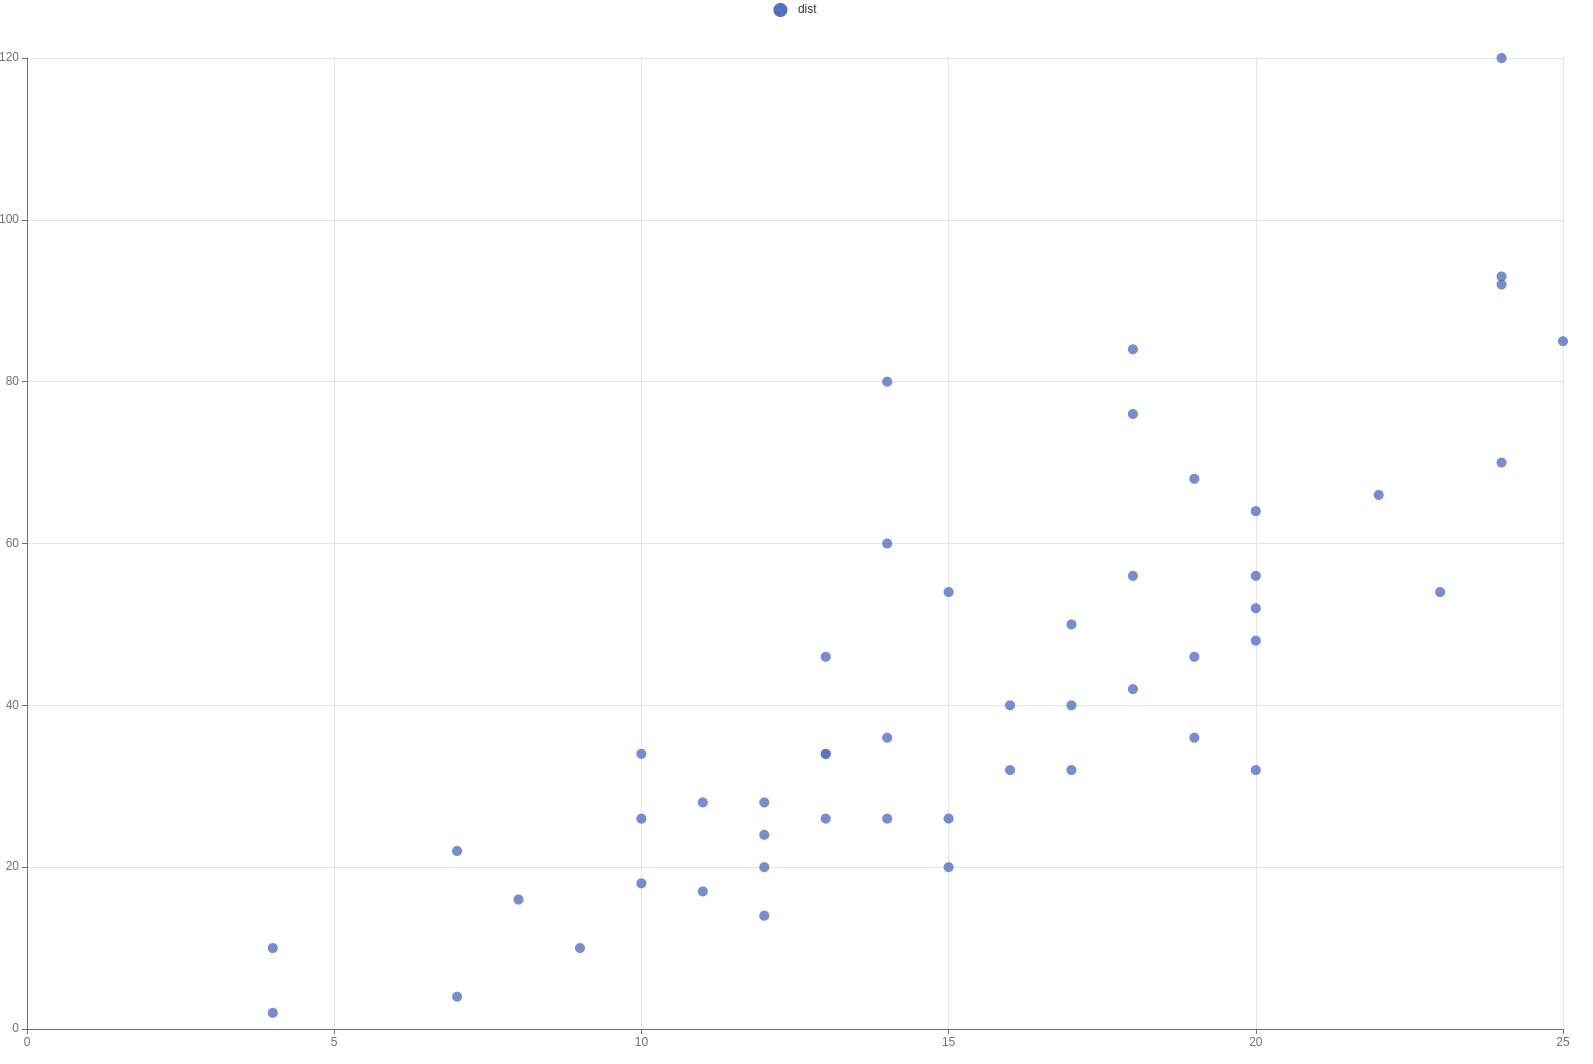
Example
Basic example.
library(echarts4r)

e_chart(cars, speed) %>%
  e_scatter(dist, symbolSize = 10)
Get it
Stable version from CRAN.
install.packages("echarts4r")
The development version from Github.
# install.packages("remotes")
remotes::install_github("JohnCoene/echarts4r")
Code of Conduct
Please note that the echarts4r project is released with a Contributor Code of Conduct. By contributing to this project, you agree to abide by its terms.