Fully-Latent Principal Stratification.
Fully Latent Principal Stratification (FLPS)[^1]
Fully Latent Principal Stratification (FLPS) is an extension of principal stratification.
Installation
Install the latest release from CRAN or git repository:
devtools::install_github("sooyongl/flps")
install.packages("flps")
library(flps)
## Version: 1.0.0
##
## It is a demo.
## Acknowledgements. It is supported by the Institute of Education Sciences, U.S. Department of Education, through Grant R305D210036.
Basic working example
Load Example Data
binary: a data frame containing all the data for FLPS. It is used inrunFLPSfunction.- This data will be converted to a list of data for
rstanpackage. - For latent variable models, Rasch, 2PL, GRM, SEM (one-factor CFA), and mixture models (LCA and LPA) are available.
- Multilevel structure will be supported soon.
data(binary)
# Input data frame
data.table::data.table(binary)
##       schid    id   sex  race pretest stdscore    cm_sex   cm_race cm_pretest
##       <int> <int> <int> <int>   <int>    <num>     <num>     <num>      <num>
##    1:     1  2383     0     1      20  -0.3296 0.4406780 0.9322034   14.81356
##    2:     1  2384     1     0       8   1.1597 0.4406780 0.9322034   14.81356
##    3:     1  2385     0     1      14  -0.7385 0.4406780 0.9322034   14.81356
##    4:     1  2387     0     1      12  -1.3518 0.4406780 0.9322034   14.81356
##    5:     1  2388     0     1       6  -1.2057 0.4406780 0.9322034   14.81356
##   ---
## 4762:    63  4761     0     1      16   0.6457 0.4860558 0.3944223   17.03187
## 4763:    63  4763     0     0      11   0.3168 0.4860558 0.3944223   17.03187
## 4764:    63  4764     0     0      18  -0.4114 0.4860558 0.3944223   17.03187
## 4765:    63  4765     1     0      31   2.2116 0.4860558 0.3944223   17.03187
## 4766:    63  4766     1     1      13  -0.0668 0.4860558 0.3944223   17.03187
##       cm_stdscore   trt      Y    q1    q2    q3    q4    q5    q6    q7    q8
##             <num> <int>  <num> <int> <int> <int> <int> <int> <int> <int> <int>
##    1:  -0.4068119     1 -0.487     0    NA     1     1     1     1     1    NA
##    2:  -0.4068119     1  0.487     1    NA     1     1     1     1     1     1
##    3:  -0.4068119     1 -1.073     0    NA     1     1     0    NA    NA    NA
##    4:  -0.4068119     1 -1.087     0    NA     1     1     1    NA    NA    NA
##    5:  -0.4068119     1 -1.171     0    NA     1     1    NA    NA    NA    NA
##   ---
## 4762:   0.0997502     0 -0.114     0    NA    NA    NA    NA    NA    NA    NA
## 4763:   0.0997502     0 -0.438     0    NA    NA    NA    NA    NA    NA    NA
## 4764:   0.0997502     0 -1.047     0    NA    NA    NA    NA    NA    NA    NA
## 4765:   0.0997502     0  0.765     0    NA    NA    NA    NA    NA    NA    NA
## 4766:   0.0997502     0  0.539     0    NA    NA    NA    NA    NA    NA    NA
##          q9   q10   q11   q12   q13   q14   q15   q16   q17   q18   q19   q20
##       <int> <int> <int> <int> <int> <int> <int> <int> <int> <int> <int> <int>
##    1:    NA    NA    NA    NA    NA    NA    NA    NA    NA    NA    NA    NA
##    2:     1     1     1     1    NA    NA    NA    NA    NA    NA    NA    NA
##    3:    NA    NA    NA    NA    NA    NA    NA    NA    NA    NA    NA    NA
##    4:    NA    NA    NA    NA    NA    NA    NA    NA    NA    NA    NA    NA
##    5:    NA    NA    NA    NA    NA    NA    NA    NA    NA    NA    NA    NA
##   ---
## 4762:    NA    NA    NA    NA    NA    NA    NA    NA    NA    NA    NA    NA
## 4763:    NA    NA    NA    NA    NA    NA    NA    NA    NA    NA    NA    NA
## 4764:    NA    NA    NA    NA    NA    NA    NA    NA    NA    NA    NA    NA
## 4765:    NA    NA    NA    NA    NA    NA    NA    NA    NA    NA    NA    NA
## 4766:    NA    NA    NA    NA    NA    NA    NA    NA    NA    NA    NA    NA
Model Fitting with FLPS
runFLPS()internally transforms binary data into the format suitable forrstan, subsequently executing FLPS.To avoid re-compiling the Stan code each time, pre-compile it using
modelBuilder(), which stores the stanmodel object in theflpsdirectory, accelerating subsequent analyses.Once the Stan model is compiled, use
importModel()to bring in the compiled Stan code. This code can then be provided to thecompiled_stanargument inrunFLPS.If this step is omitted,runFLPS()will compile the Stan code during each execution of FLPS.
modelBuilder(type = "rasch")
complied_stan <- importModel(type = "rasch")
- In case of errors, try the latest
rstanandStanHeaderspackages.
remove.packages(c("rstan", "StanHeaders"))
install.packages("rstan", repos = c("https://mc-stan.org/r-packages/", getOption("repos")))
Now, execute your FLPS model. Given the time-intensive nature of the process, chains and iterations have been initially limited to 1 and 5000, respectively. It is advisable to increase these values for your specific research needs.
# Subset of data: 1000 students
binary <- binary[c(sample(which(binary$trt == 1), 250),
                   sample(which(binary$trt == 0), 250)),]

res <- runFLPS(
  inp_data = binary,
  # complied_stan = complied # if necessary
  outcome = "Y",
  trt = "trt",
  covariate = c("sex","race","pretest","stdscore"),
  lv_type = "rasch",
  lv_model = "F =~ q1 + q2 + q3 + q4 + q5 + q6 + q7 + q8 + q9 + q10",
  stan_options = list(iter = 5000, cores = 1, chains = 2)
)
Results
Retrieve summaries and visualize results with the following:
summary(res)
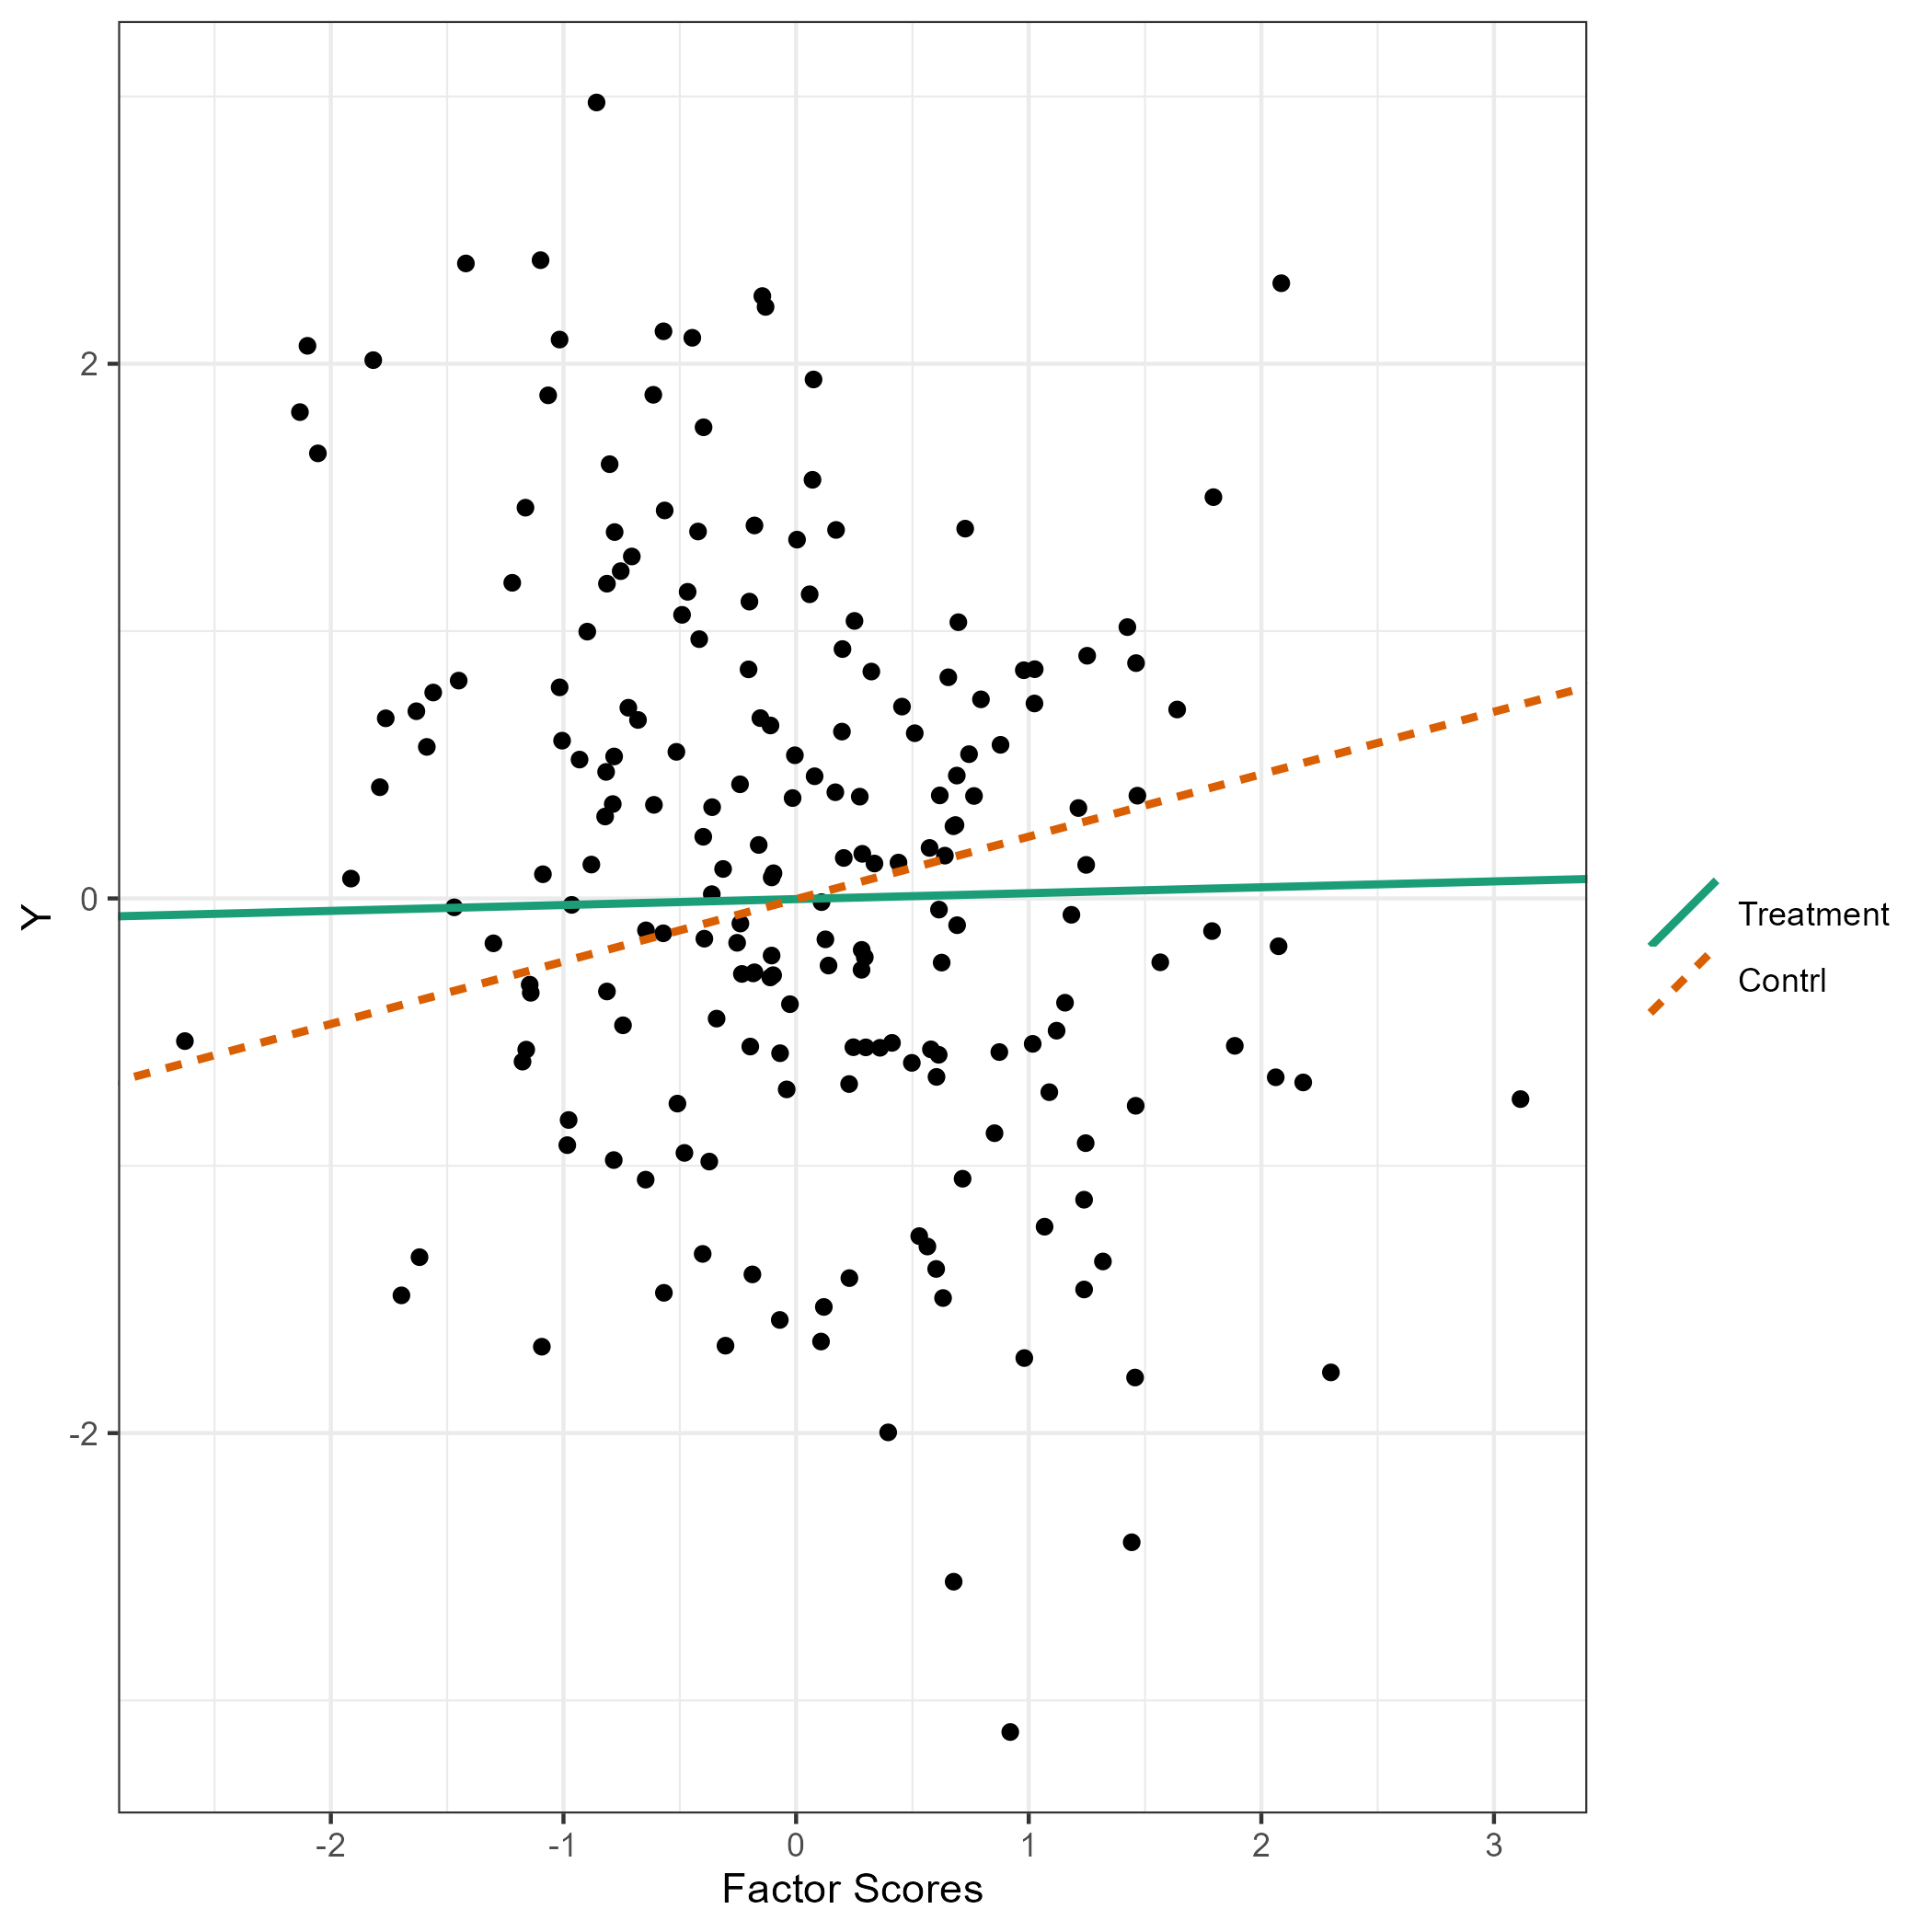
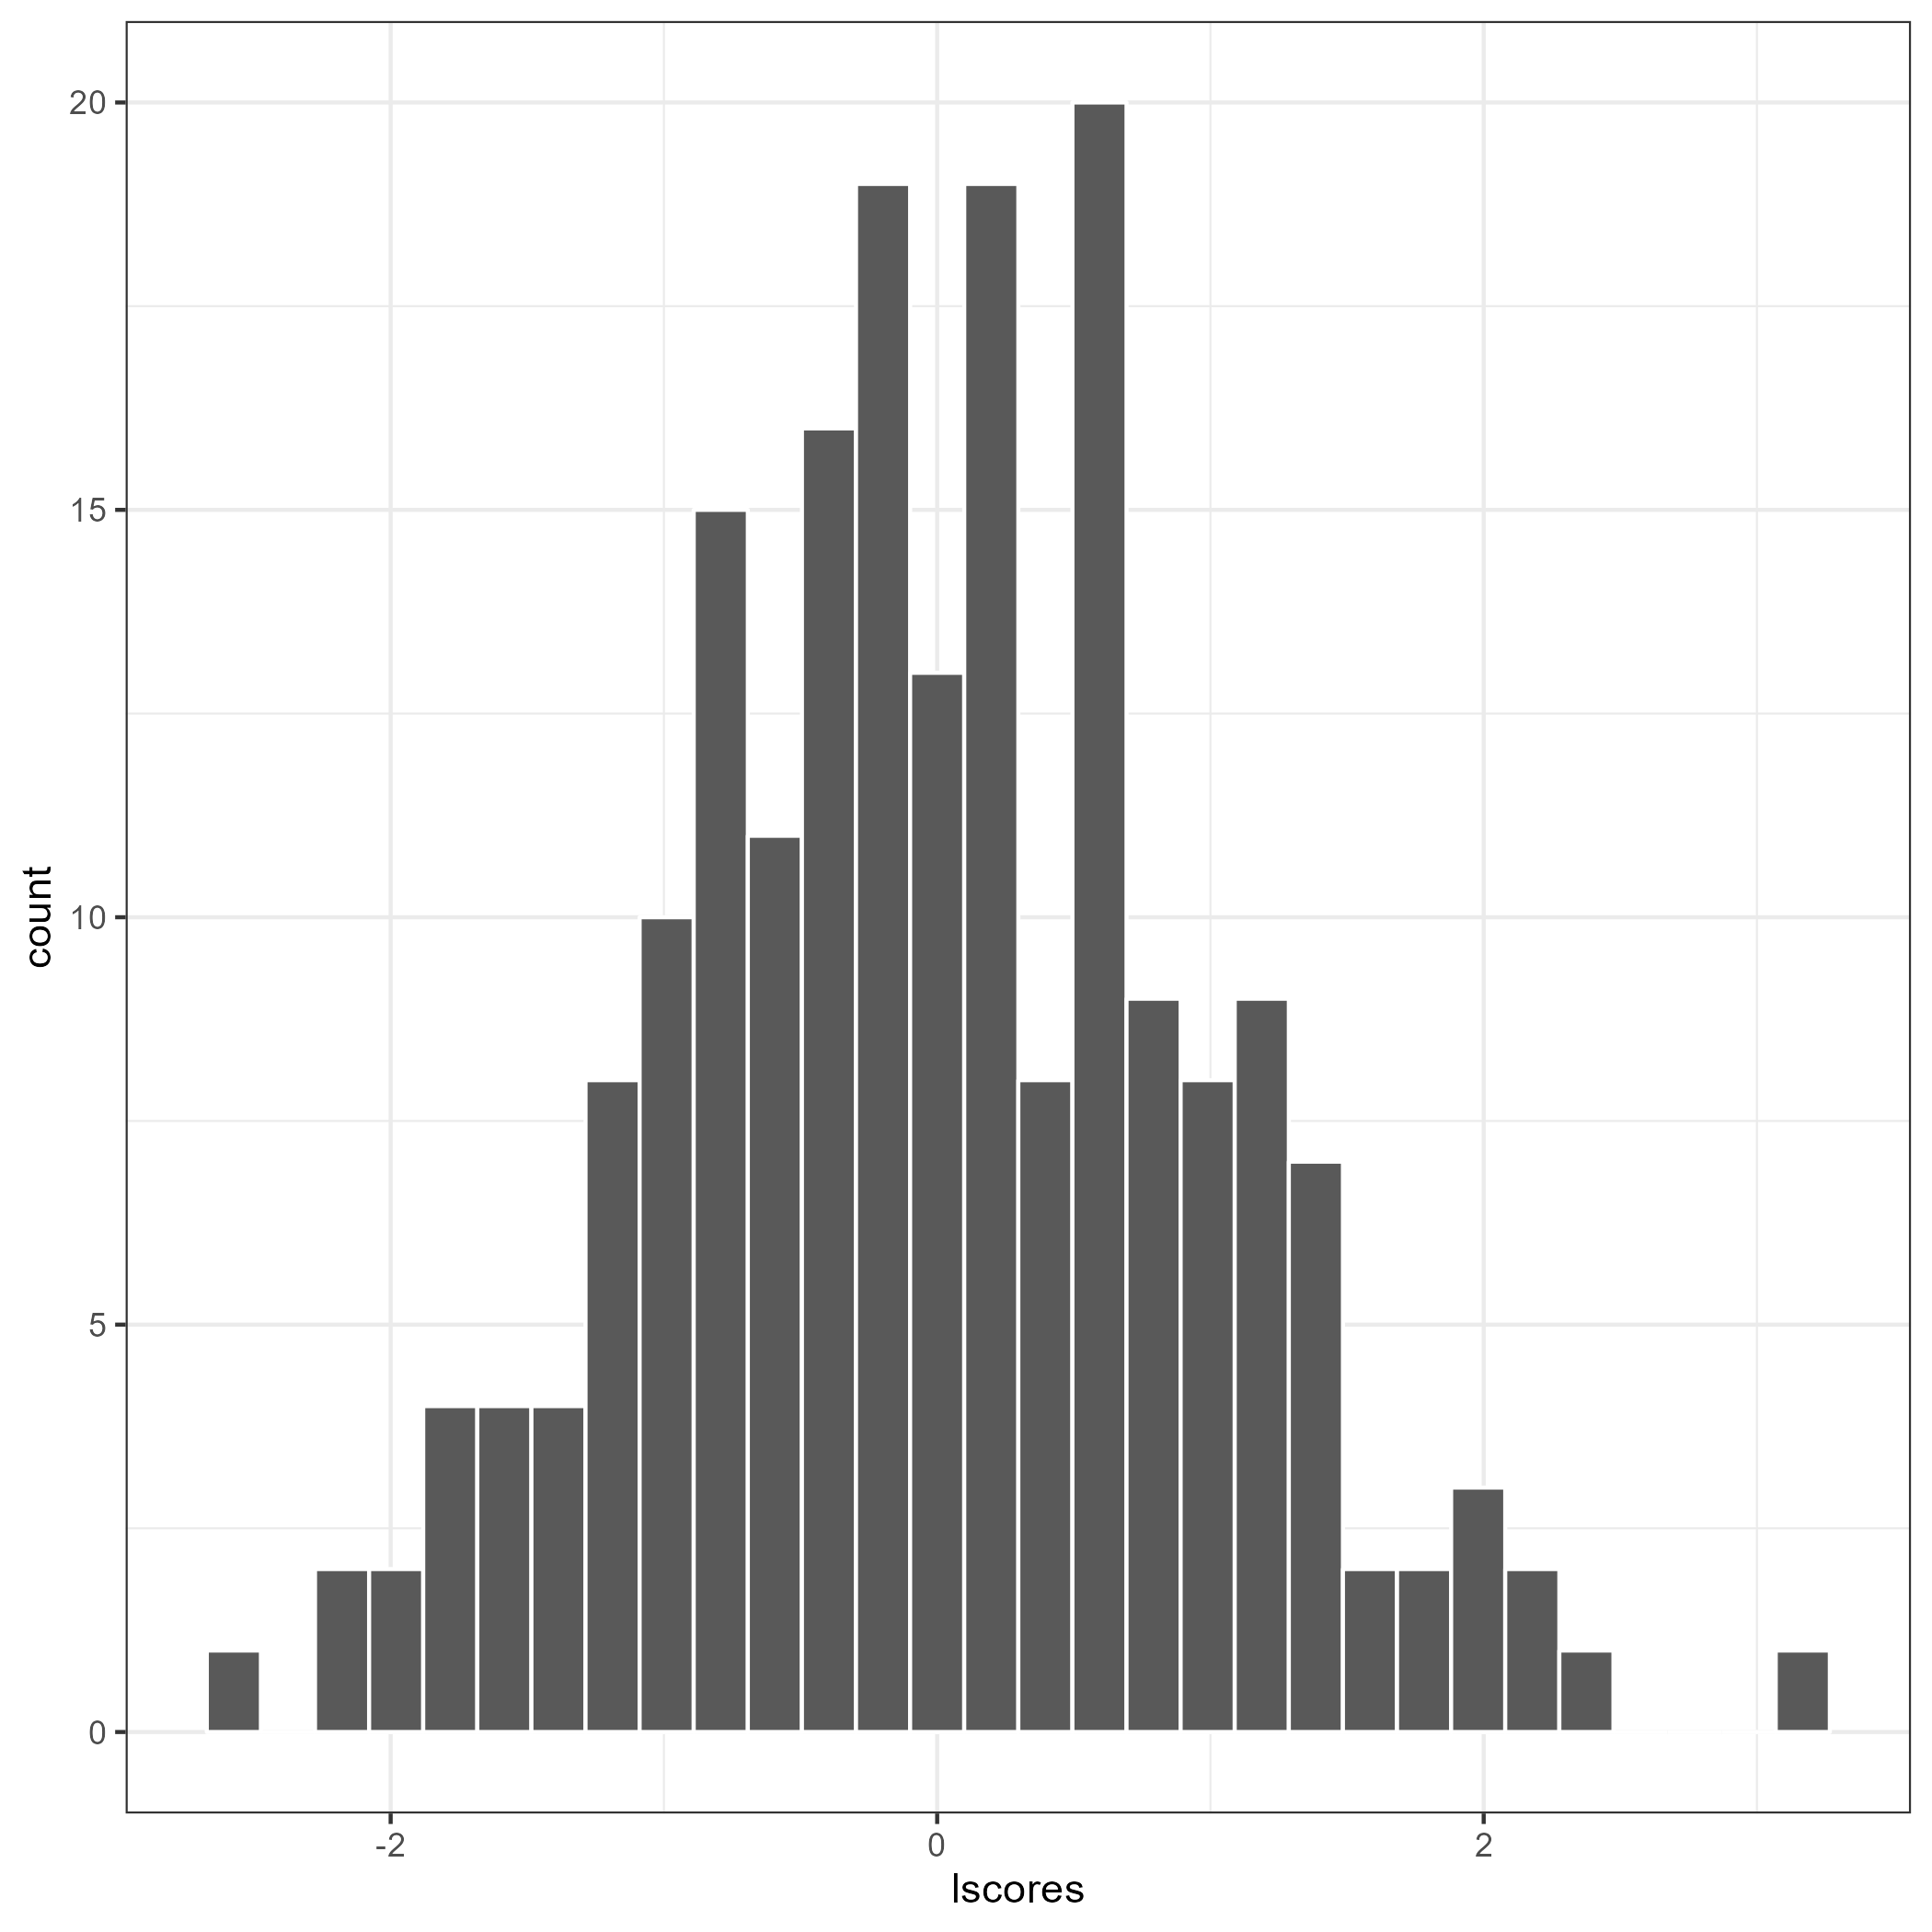
The flps_plot() shows the plot related to FLPS models
flps_plot(res, type = "causal")

flps_plot(res, type = "latent")

[^1]: Acknowledgements. This package is supported by the Institute of Education Sciences, U.S. Department of Education, through Grant R305D210036.