Visualise Function Dependencies.
foodwebr
![]()
foodwebr makes it easy to visualise the dependency graph of a set of functions (i.e. who calls who). This can be useful for exploring an unfamiliar codebase, or reminding yourself what you wrote ten minutes ago
Installation
You can install foodwebr from GitHub:
devtools::install_github("lewinfox/foodwebr")
Basic usage
Say we have a bunch of functions in the global environment, some of which call each other:
library(foodwebr)

f <- function() 1
g <- function() f()
h <- function() { f(); g() }
i <- function() { f(); g(); h() }
j <- function() j()
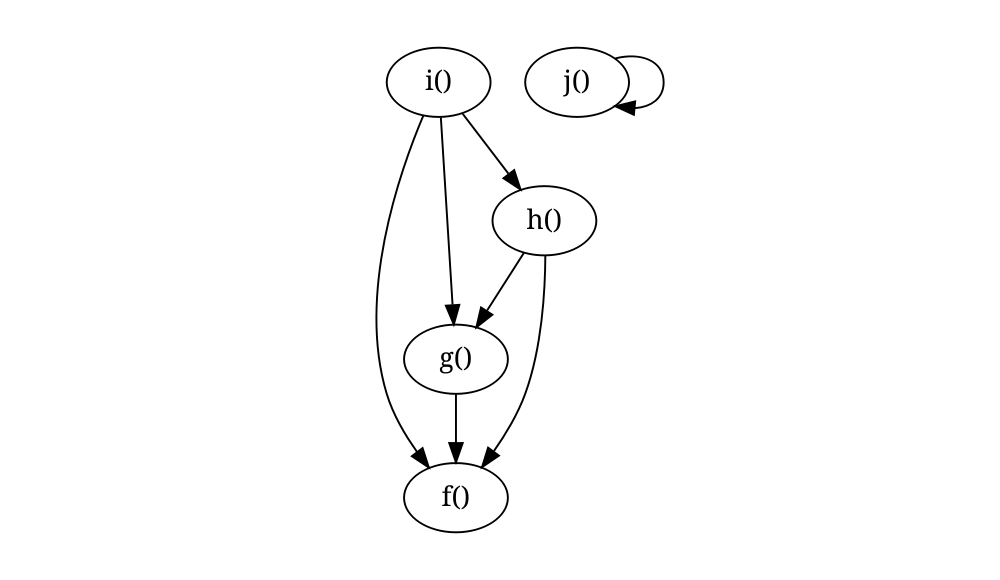
A call to foodweb() will calculate a graph of the dependencies.
fw <- foodweb()
Printing the object will show the graphviz representation:
fw
#> # A `foodweb`: 5 vertices and 7 edges
#> digraph 'foodweb' {
#>   f()
#>   g() -> { f() }
#>   h() -> { f(), g() }
#>   i() -> { f(), g(), h() }
#>   j() -> { j() }
#> }
Plotting will draw the graph.
plot(fw)
foodweb() looks at its calling environment by default. If you want to look at another environment you can either pass a function to the FUN argument of foodweb() or pass an environment to the env argument. If FUN is provided then the value of env is ignored, and the environment of FUN will be used.
Filtering
If a specific function is passed to FUN, the default behaviour is to remove functions that are not descendants or antecedents of that function.
# `j()` will not be included
foodweb(FUN = g)
#> # A `foodweb`: 4 vertices and 6 edges
#> digraph 'foodweb' {
#>   g() -> { f() }
#>   h() -> { g(), f() }
#>   i() -> { g(), h(), f() }
#>   f()
#> }

# Force inclusion of unconnected functions by using `filter = FALSE`
foodweb(FUN = g, filter = FALSE)
#> # A `foodweb`: 5 vertices and 7 edges
#> digraph 'foodweb' {
#>   f()
#>   g() -> { f() }
#>   h() -> { f(), g() }
#>   i() -> { f(), g(), h() }
#>   j() -> { j() }
#> }
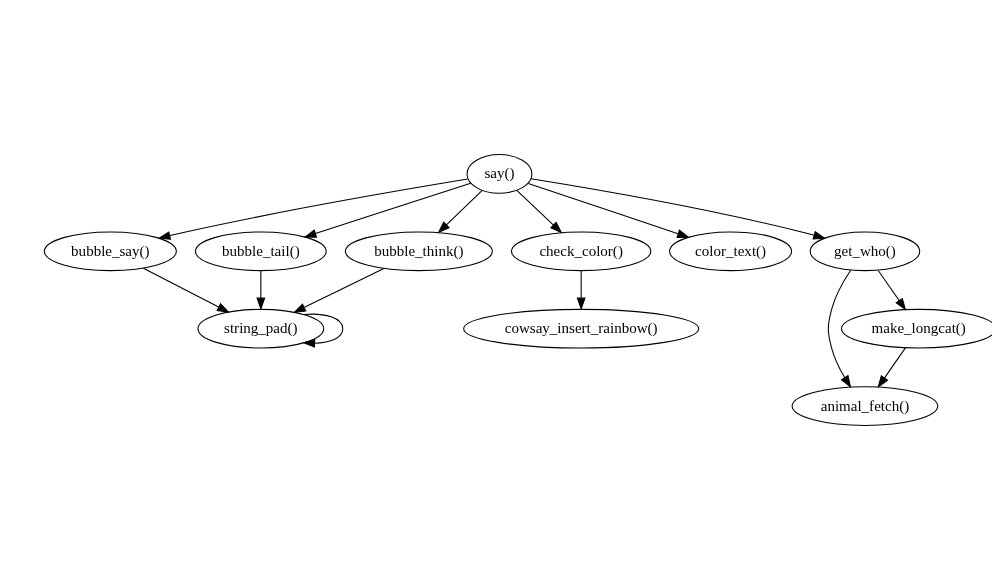
You can use this feature when exploring code in other packages: calling foodweb() on a function in another package will show you how functions in that package relate to each other. I’m using cowsay here as it’s small enough that the output is readable.
By default when calling foodweb() on a specific function we only see functions that are in the direct line of descendants or antecendents of the specified function.
if (requireNamespace("cowsay", quietly = TRUE)) {
  plot(foodweb(cowsay::say))
}
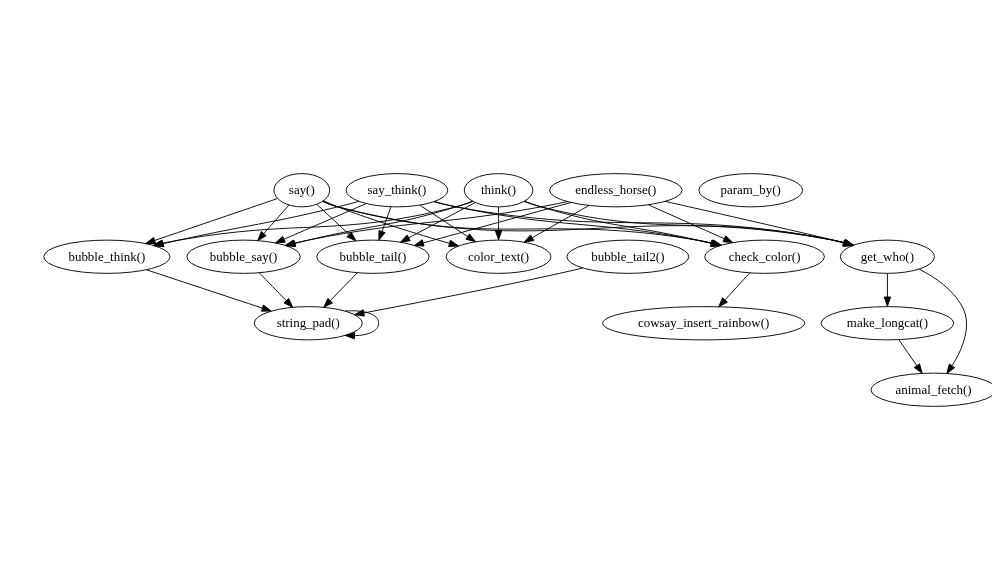
If we want to include all functions in the package, we can pass filter = FALSE:
if (requireNamespace("cowsay", quietly = TRUE)) {
  plot(foodweb(cowsay::say, filter = FALSE))
}
Extra graphviz options
In case you want to do something with the graphviz output (make it prettier, for example), you can pass additional arguments to plot(). These will be passed directly to DiagrammeR::grViz().
Foodweb as text
foodweb(as.text = TRUE)
#> digraph 'foodweb' {
#>   "f()"
#>   "g()" -> { "f()" }
#>   "h()" -> { "f()", "g()" }
#>   "i()" -> { "f()", "g()", "h()" }
#>   "j()" -> { "j()" }
#> }
Calling as.character() on a foodweb object will have the same effect.
Using tidygraph
The tidygraph package provides tools for graph analysis. A foodweb object can be converted into a tidy graph object using tidygraph::as_tbl_graph() to allow more sophisticated analysis and visualisation.
if (requireNamespace("tidygraph", quietly = TRUE)) {
  tg <- tidygraph::as_tbl_graph(foodweb())
  tg
}
#> # A tbl_graph: 5 nodes and 7 edges
#> #
#> # A directed multigraph with 2 components
#> #
#> # Node Data: 5 × 1 (active)
#>   name
#>   <chr>
#> 1 f
#> 2 g
#> 3 h
#> 4 i
#> 5 j
#> #
#> # Edge Data: 7 × 2
#>    from    to
#>   <int> <int>
#> 1     2     1
#> 2     3     1
#> 3     3     2
#> # ℹ 4 more rows
See also
foodwebr is similar to these functions/packages:
mvbutils::foodweb(): The OG of function dependency graphs in R, and the inspiration for foodwebr. Less user-friendly output, in my opinion.DependenciesGraphs: Provides much nicer visualisations but does not appear to be actively maintained.