Description
Forest Plots from Regression Models.
Description
Produces forest plots using 'ggplot2' from models produced by functions such as stats::lm(), stats::glm() and survival::coxph().
README.md
forestmodel

![]()
This is an R package to generate forest plots of the coefficients of models produced by lm, glm, survival::coxph, etc.
The main function is forest_model, with a helper function default_forest_panels to produce the necessary panelsdata.frame.
Installation
The package can be installed using install.packages. It needs Hadley Wickham’s broom, dplyr, gpplot2 and lazyeval packages.
Development takes place on the github repository https://github.com/NikNakk/forestmodel/.
Installation
You can install the released version of forestmodel from CRAN with:
install.packages("forestmodel")
And the development version from GitHub with:
# install.packages("devtools")
devtools::install_github("NikNakk/forestmodel")
Example
library(forestmodel)
library(survival)
library(dplyr)
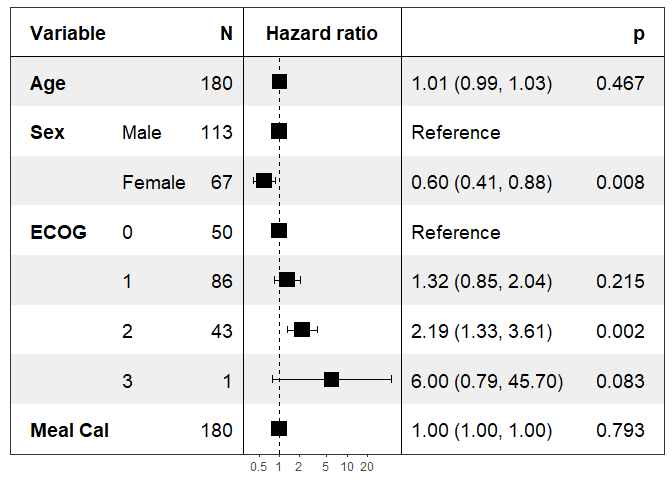
pretty_lung <- lung %>%
transmute(time,
status,
Age = age,
Sex = factor(sex, labels = c("Male", "Female")),
ECOG = factor(lung$ph.ecog),
`Meal Cal` = meal.cal)
print(forest_model(coxph(Surv(time, status) ~ ., pretty_lung)))
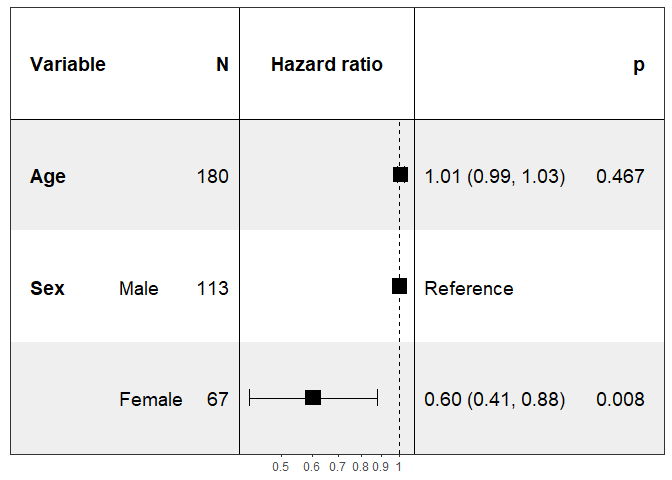
Specifying the covariates to show:
print(forest_model(coxph(Surv(time, status) ~ ., pretty_lung),
                   covariates = c("Age", "Sex")))