Description
Automated Cumulative Frequency Plots for Grouped Distribution.
Description
Input has to be in the form of vectors of lower class limits and upper class limits and frequencies; the output will give a cumulative frequency distribution table with cumulative frequency plot.
README.md
freqdistributionNogives
The goal of freqdistributionNogives is to automate the process of GROUPED FREQUENCY DISTRIBUTION data-framing and cumulative frequency graph.
Installation
You can install the development version of freqdistributionNogives like so: The Public Repository can be accessed in the following manner:-
# FILL THIS IN! HOW CAN PEOPLE INSTALL YOUR DEV PACKAGE?
Development Package Link :- https://github.com/Harshit-Budakoti/packagetest
1)Install the package devtools in Rstudio.
install.packages(devtools)
2)Run the code given below to install the Development Version Repository using
##devtools::install_github('Harshit-Budakoti/packagetest')
3) After installation:-
use the function basicfreqdist(lowerclasslimits,upperclasslimits,frequencies)
The working of the packages has been illustrated using an example.
Example
This is a basic example which shows you how to use this package to get automated frequency distribution table with cumulative frequencies and cumulative frequency plot:
library(freqdistributionNogives)
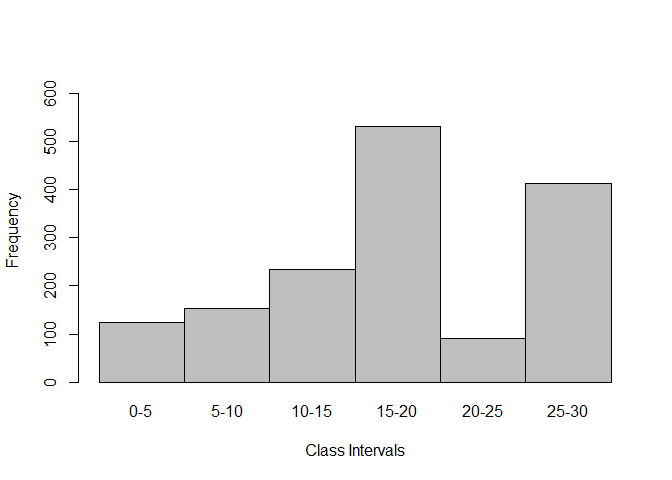
lowerlimits=c(0,5,10,15,20,25)
upperlimits=c(5,10,15,20,25,30)
frequencies=c(124,153,234,531,91,414)
basicfreqdist(lowerlimits,upperlimits,frequencies)

#>   LL UL classmark freq morecf lesscf
#> 1  0  5       2.5  124   1547    124
#> 2  5 10       7.5  153   1423    277
#> 3 10 15      12.5  234   1270    511
#> 4 15 20      17.5  531   1036   1042
#> 5 20 25      22.5   91    505   1133
#> 6 25 30      27.5  414    414   1547

## basic example code
```
The figure given below gives us the Histogram plot of the given data 