Description
Generate Test Matrices for Numerical Experiments.
Description
Generates a variety of structured test matrices commonly used in numerical linear algebra and computational experiments. Includes well-known matrices for benchmarking and testing the performance, stability, and accuracy of linear algebra algorithms. Inspired by 'MATLAB' 'gallery' functions.
README.md
gallery
The goal of gallery is to replicate the MATLAB gallery of test matrices in R.
Installation
You can install the released version of gallery from GitHub with:
devtools::install_github("tXiao95/gallery")
Example
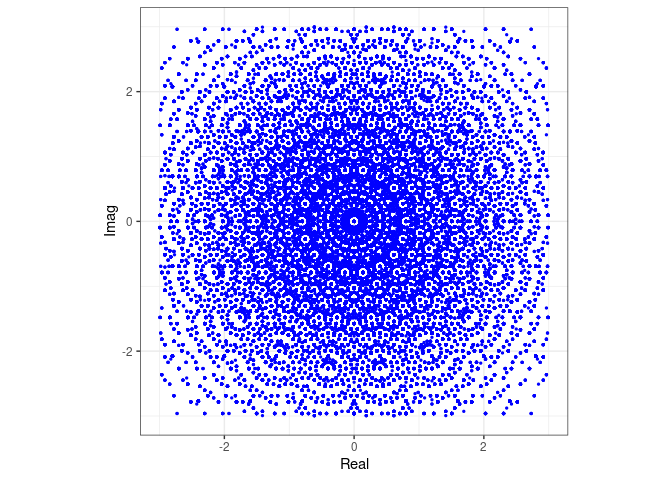
This example can be found on the MATLAB website. We will plot the distribution of eigenvalues from a sample of 20,000 random circulant matrices of size 18 by 18 in the complex plane.
library(gallery)
library(ggplot2)

E <- matrix(0, nrow = 18, ncol = 20000)

for(i in 1:20000){
  x <- -0.4 + 0.8*sample(0:1, 18, replace = TRUE)
  A <- gallery::circul(x)
  E[,i] <- eigen(A, only.values = TRUE)$values
}

df <- data.frame(Real = Re(c(E)), Imag = Im(c(E)))

ggplot(df, aes(Real, Imag)) +
  geom_point(col = "blue", size = 0.5) +
  scale_x_continuous(limits=c(-3,3)) +
  scale_y_continuous(limits=c(-3,3)) +
  coord_fixed(ratio=1) +
  theme_bw()
#> Warning: Removed 10249 rows containing missing values or values outside the scale range
#> (`geom_point()`).