Description
Data from Gapminder.
Description
An excerpt of the data available at Gapminder.org. For each of 142 countries, the package provides values for life expectancy, GDP per capita, and population, every five years, from 1952 to 2007.
README.md
gapminder
This repo is a data package with an excerpt from the Gapminder data. The main object in this package is the gapminder data frame or “tibble”. There are other goodies, such as the data in tab delimited form, a larger unfiltered dataset, premade color schemes for the countries and continents, and ISO 3166-1 country codes. The primary use case is for teaching and writing examples.
Installation
Install gapminder from CRAN:
install.packages("gapminder")
Quick look
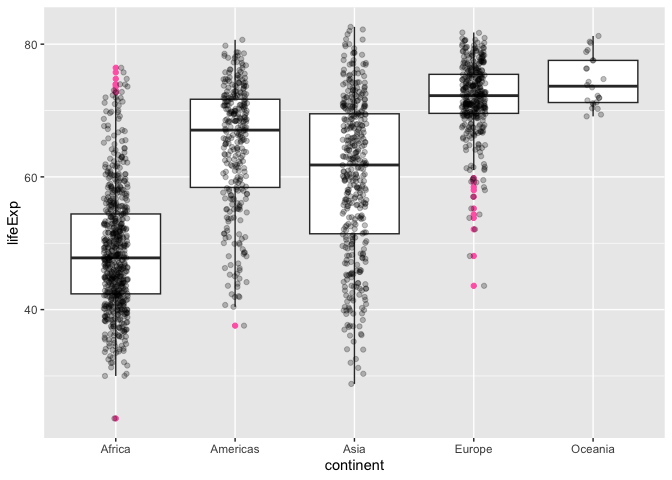
Here we do a bit of data aggregation and plotting with the gapminder data:
library(gapminder)
library(dplyr)
library(ggplot2)

aggregate(lifeExp ~ continent, gapminder, median)
#>   continent lifeExp
#> 1    Africa 47.7920
#> 2  Americas 67.0480
#> 3      Asia 61.7915
#> 4    Europe 72.2410
#> 5   Oceania 73.6650

gapminder %>%
  filter(year == 2007) %>%
  group_by(continent) %>%
  summarise(lifeExp = median(lifeExp))
#> # A tibble: 5 × 2
#>   continent lifeExp
#>   <fct>       <dbl>
#> 1 Africa       52.9
#> 2 Americas     72.9
#> 3 Asia         72.4
#> 4 Europe       78.6
#> 5 Oceania      80.7

ggplot(gapminder, aes(x = continent, y = lifeExp)) +
  geom_boxplot(outlier.colour = "hotpink") +
  geom_jitter(position = position_jitter(width = 0.1, height = 0), alpha = 1 / 4)

For more, see the Get started vignette.