Description
Visualization of 'exametrika' Output Using 'ggplot2'.
Description
Provides 'ggplot2'-based visualization functions for output objects from the 'exametrika' package, which implements test data engineering methods described in Shojima (2022, ISBN:978-981-16-9547-1). Supports a wide range of psychometric models including Item Response Theory, Latent Class Analysis, Latent Rank Analysis, Biclustering (binary, ordinal, and nominal), Bayesian Network Models, and related network models. All plot functions return 'ggplot2' objects that can be further customized by the user.
README.md
ggExametrika
![]()
![]()
ggExametrika provides ggplot2-based visualization for the exametrika package. It supports a wide range of psychometric models:
| Model | Description |
|---|---|
| IRT | Item Response Theory (2PL, 3PL, 4PL) |
| GRM | Graded Response Model |
| LCA | Latent Class Analysis |
| LRA | Latent Rank Analysis |
| LRAordinal | Latent Rank Analysis for ordinal data |
| LRArated | Latent Rank Analysis for rated data |
| Biclustering | Simultaneous item/student clustering (binary) |
| nominalBiclustering | Biclustering for nominal data |
| ordinalBiclustering | Biclustering for ordinal data |
| IRM | Infinite Relational Model |
| LDLRA | Locally Dependent Latent Rank Analysis |
| LDB | Locally Dependent Biclustering |
| BINET | Bayesian Network and Test |
| BNM | Bayesian Network Model |
Reference
Shojima, Kojiro (2022) Test Data Engineering: Latent Rank Analysis, Biclustering, and Bayesian Network (Behaviormetrics: Quantitative Approaches to Human Behavior, 13), Springer, ISBN 978-981-16-9985-6
Installation
# install.packages("devtools")
devtools::install_github("kosugitti/ggExametrika")
Examples
All plot functions take exametrika output directly and return ggplot objects. Functions are named plotXXX_gg().
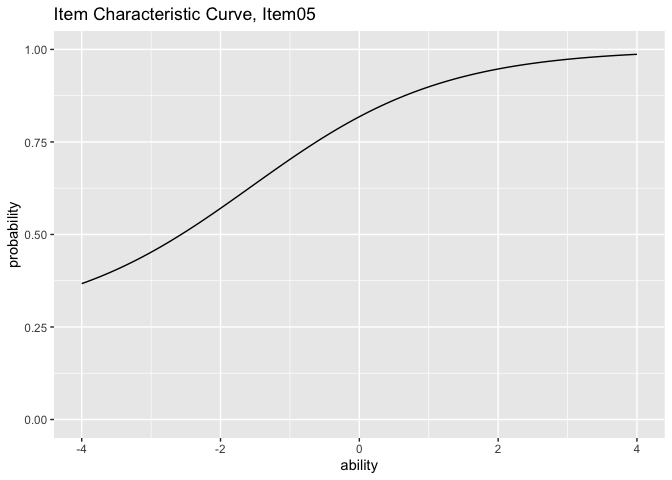
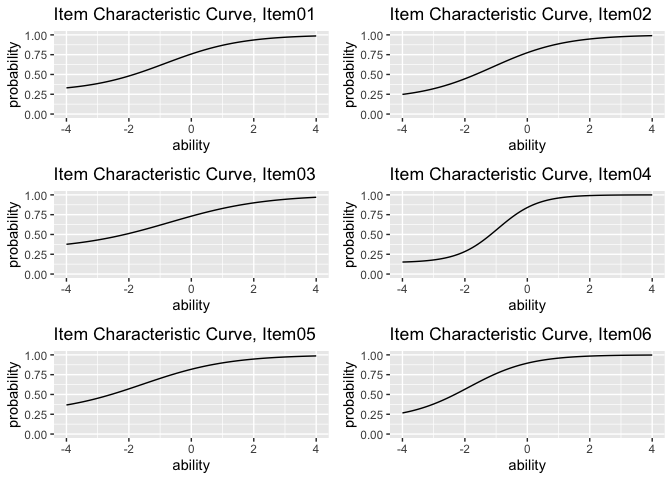
IRT: Item Characteristic Curve (plotICC_gg)
library(exametrika)
library(ggExametrika)

result_irt <- IRT(J15S500, model = 3)
plots <- plotICC_gg(result_irt)
plots[[5]]
combinePlots_gg(plots)
IRT: Overlay Plots (plotICC_overlay_gg, plotIIC_overlay_gg)
# All ICCs on a single plot
plotICC_overlay_gg(result_irt, show_legend = TRUE)

# All IICs on a single plot (also works with GRM)
plotIIC_overlay_gg(result_irt, items = c(1, 3, 5), show_legend = TRUE)
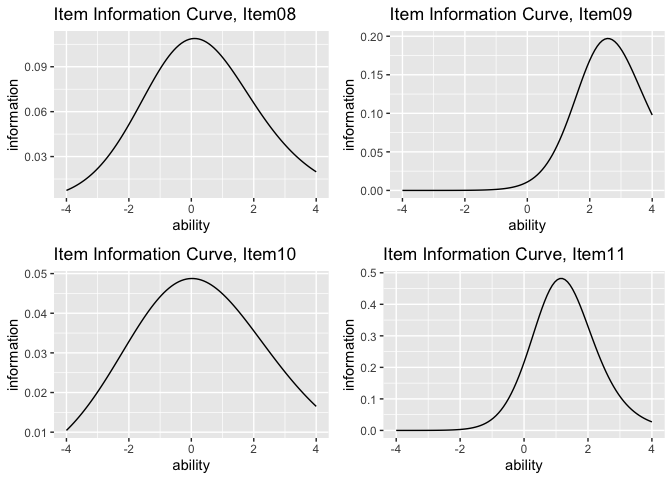
IRT: Item Information Curve (plotIIC_gg)
plots <- plotIIC_gg(result_irt)
combinePlots_gg(plots, selectPlots = 8:11)
IRT: Test Information Curve / Test Response Function (plotTIC_gg, plotTRF_gg)
plotTIC_gg(result_irt)
plotTRF_gg(result_irt)
GRM: Item Category Response Function (plotICRF_gg)
result_grm <- GRM(J5S1000)
plots <- plotICRF_gg(result_grm)
plots[[1]]
combinePlots_gg(plots, selectPlots = 1:5)

# GRM also supports IIC and TIC
plotIIC_gg(result_grm)
plotTIC_gg(result_grm)
LCA: Latent Class Analysis
result_lca <- LCA(J15S500, ncls = 3)

plotIRP_gg(result_lca)         # Item Reference Profile
plotFRP_gg(result_lca)         # Field Reference Profile
plotTRP_gg(result_lca)         # Test Reference Profile
plotLCD_gg(result_lca)         # Latent Class Distribution
plotCMP_gg(result_lca)         # Class Membership Profile
LRA: Latent Rank Analysis
result_lra <- LRA(J15S500, nrank = 4)

plotIRP_gg(result_lra)         # Item Reference Profile
plotFRP_gg(result_lra)         # Field Reference Profile
plotTRP_gg(result_lra)         # Test Reference Profile
plotLRD_gg(result_lra)         # Latent Rank Distribution
plotRMP_gg(result_lra)         # Rank Membership Profile
LRAordinal / LRArated
result_lra_ord <- LRA(J5S1000, nrank = 4)  # ordinal data

plotScoreFreq_gg(result_lra_ord)   # Score Frequency Distribution
plotScoreRank_gg(result_lra_ord)   # Score-Rank Heatmap
plotICRP_gg(result_lra_ord)        # Item Category Reference Profile
plotICBR_gg(result_lra_ord)        # Item Category Boundary Response (ordinal only)
plotRMP_gg(result_lra_ord)         # Rank Membership Profile
Biclustering (binary)
result_bic <- Biclustering(J35S515, nfld = 5, nrank = 6)

plotFRP_gg(result_bic)         # Field Reference Profile
plotTRP_gg(result_bic)         # Test Reference Profile
plotLCD_gg(result_bic)         # Latent Class Distribution
plotLRD_gg(result_bic)         # Latent Rank Distribution
plotCMP_gg(result_bic)         # Class Membership Profile
plotRMP_gg(result_bic)         # Rank Membership Profile
plotCRV_gg(result_bic)         # Class Reference Vector
plotRRV_gg(result_bic)         # Rank Reference Vector
plotArray_gg(result_bic)       # Array Plot (heatmap)
Biclustering (nominal / ordinal)
# Nominal Biclustering
result_nom <- Biclustering(data, ncls = 3, nfld = 4)

plotFRP_gg(result_nom, stat = "mean")   # stat: "mean", "median", or "mode"
plotFCRP_gg(result_nom, style = "line") # Field Category Response Profile (style: "line" or "bar")
plotScoreField_gg(result_nom)           # Expected Score Heatmap (field x class/rank)
plotCRV_gg(result_nom, stat = "mean")   # Class Reference Vector
plotRRV_gg(result_nom, stat = "mean")   # Rank Reference Vector
plotArray_gg(result_nom)                # Array Plot

# Ordinal Biclustering (additional)
plotFCBR_gg(result_ord)                 # Field Cumulative Boundary Reference (ordinal only)
LDB: Locally Dependent Biclustering
result_ldb <- LDB(J35S515, ncls = 6, nfld = 5)

plotFRP_gg(result_ldb)         # Field Reference Profile
plotTRP_gg(result_ldb)         # Test Reference Profile
plotLRD_gg(result_ldb)         # Latent Rank Distribution
plotRMP_gg(result_ldb)         # Rank Membership Profile
plotArray_gg(result_ldb)       # Array Plot
plotFieldPIRP_gg(result_ldb)   # Field Parent Item Reference Profile
plotGraph_gg(result_ldb)       # DAG per rank
BINET: Bayesian Network and Test
result_binet <- BINET(J35S515, ncls = 6, nfld = 5)

plotFRP_gg(result_binet)       # Field Reference Profile
plotTRP_gg(result_binet)       # Test Reference Profile
plotLRD_gg(result_binet)       # Latent Rank Distribution
plotRMP_gg(result_binet)       # Rank Membership Profile
plotArray_gg(result_binet)     # Array Plot
plotGraph_gg(result_binet, show_edge_label = TRUE)  # DAG with edge labels
BNM / LDLRA: DAG Visualization (plotGraph_gg)
result_bnm <- BNM(J15S500)
plotGraph_gg(result_bnm)

result_ldlra <- LDLRA(J15S500, ncls = 5)
plotGraph_gg(result_ldlra)     # One DAG per rank
Function-Model Compatibility
IRT / GRM
| Function | IRT | GRM |
|---|---|---|
| plotICC_gg | x | |
| plotICC_overlay_gg | x | |
| plotIIC_gg | x | x |
| plotIIC_overlay_gg | x | x |
| plotTIC_gg | x | x |
| plotTRF_gg | x | |
| plotICRF_gg | x |
LCA / LRA / LRAordinal / LRArated
| Function | LCA | LRA | LRAordinal | LRArated |
|---|---|---|---|---|
| plotIRP_gg | x | x | ||
| plotFRP_gg | x | x | ||
| plotTRP_gg | x | x | ||
| plotLCD_gg | x | |||
| plotLRD_gg | x | |||
| plotCMP_gg | x | |||
| plotRMP_gg | x | x | x | |
| plotScoreFreq_gg | x | x | ||
| plotScoreRank_gg | x | x | ||
| plotICRP_gg | x | x | ||
| plotICBR_gg | x |
Biclustering / IRM
| Function | Bic. | nomBic. | ordBic. | IRM |
|---|---|---|---|---|
| plotFRP_gg | x | x | x | x |
| plotTRP_gg | x | x | ||
| plotLCD_gg | x | x | x | |
| plotLRD_gg | x | x | x | |
| plotCMP_gg | x | x | x | |
| plotRMP_gg | x | x | ||
| plotCRV_gg | x | x | x | |
| plotRRV_gg | x | x | x | |
| plotArray_gg | x | x | x | x |
| plotFCRP_gg | x | x | ||
| plotFCBR_gg | x | |||
| plotScoreField_gg | x | x |
Network Models (LDLRA / LDB / BINET / BNM)
| Function | LDLRA | LDB | BINET | BNM |
|---|---|---|---|---|
| plotIRP_gg | x | |||
| plotFRP_gg | x | x | ||
| plotTRP_gg | x | x | ||
| plotLRD_gg | x | x | x | |
| plotRMP_gg | x | x | x | |
| plotArray_gg | x | x | ||
| plotFieldPIRP_gg | x | |||
| plotGraph_gg | x | x | x | x |
Utility
| Function | Description |
|---|---|
| combinePlots_gg | Arrange multiple plots in a grid |
Common Plot Options
All plot functions support these customization options:
| Parameter | Description | Default |
|---|---|---|
title | TRUE (auto), FALSE (none), or character string | TRUE |
colors | Color vector (colorblind-friendly default) | auto |
linetype | "solid", "dashed", "dotted", etc. | "solid" |
show_legend | Show/hide legend | TRUE |
legend_position | "right", "top", "bottom", "left" | "right" |
Some functions have additional parameters:
| Parameter | Functions | Description |
|---|---|---|
stat | plotFRP_gg, plotCRV_gg, plotRRV_gg | "mean", "median", or "mode" for polytomous data |
style | plotFCRP_gg | "line" or "bar" |
show_labels | plotRRV_gg | Show value labels (uses ggrepel) |