A 'ggplot2' Extension for Composable Visualization.
ggalign 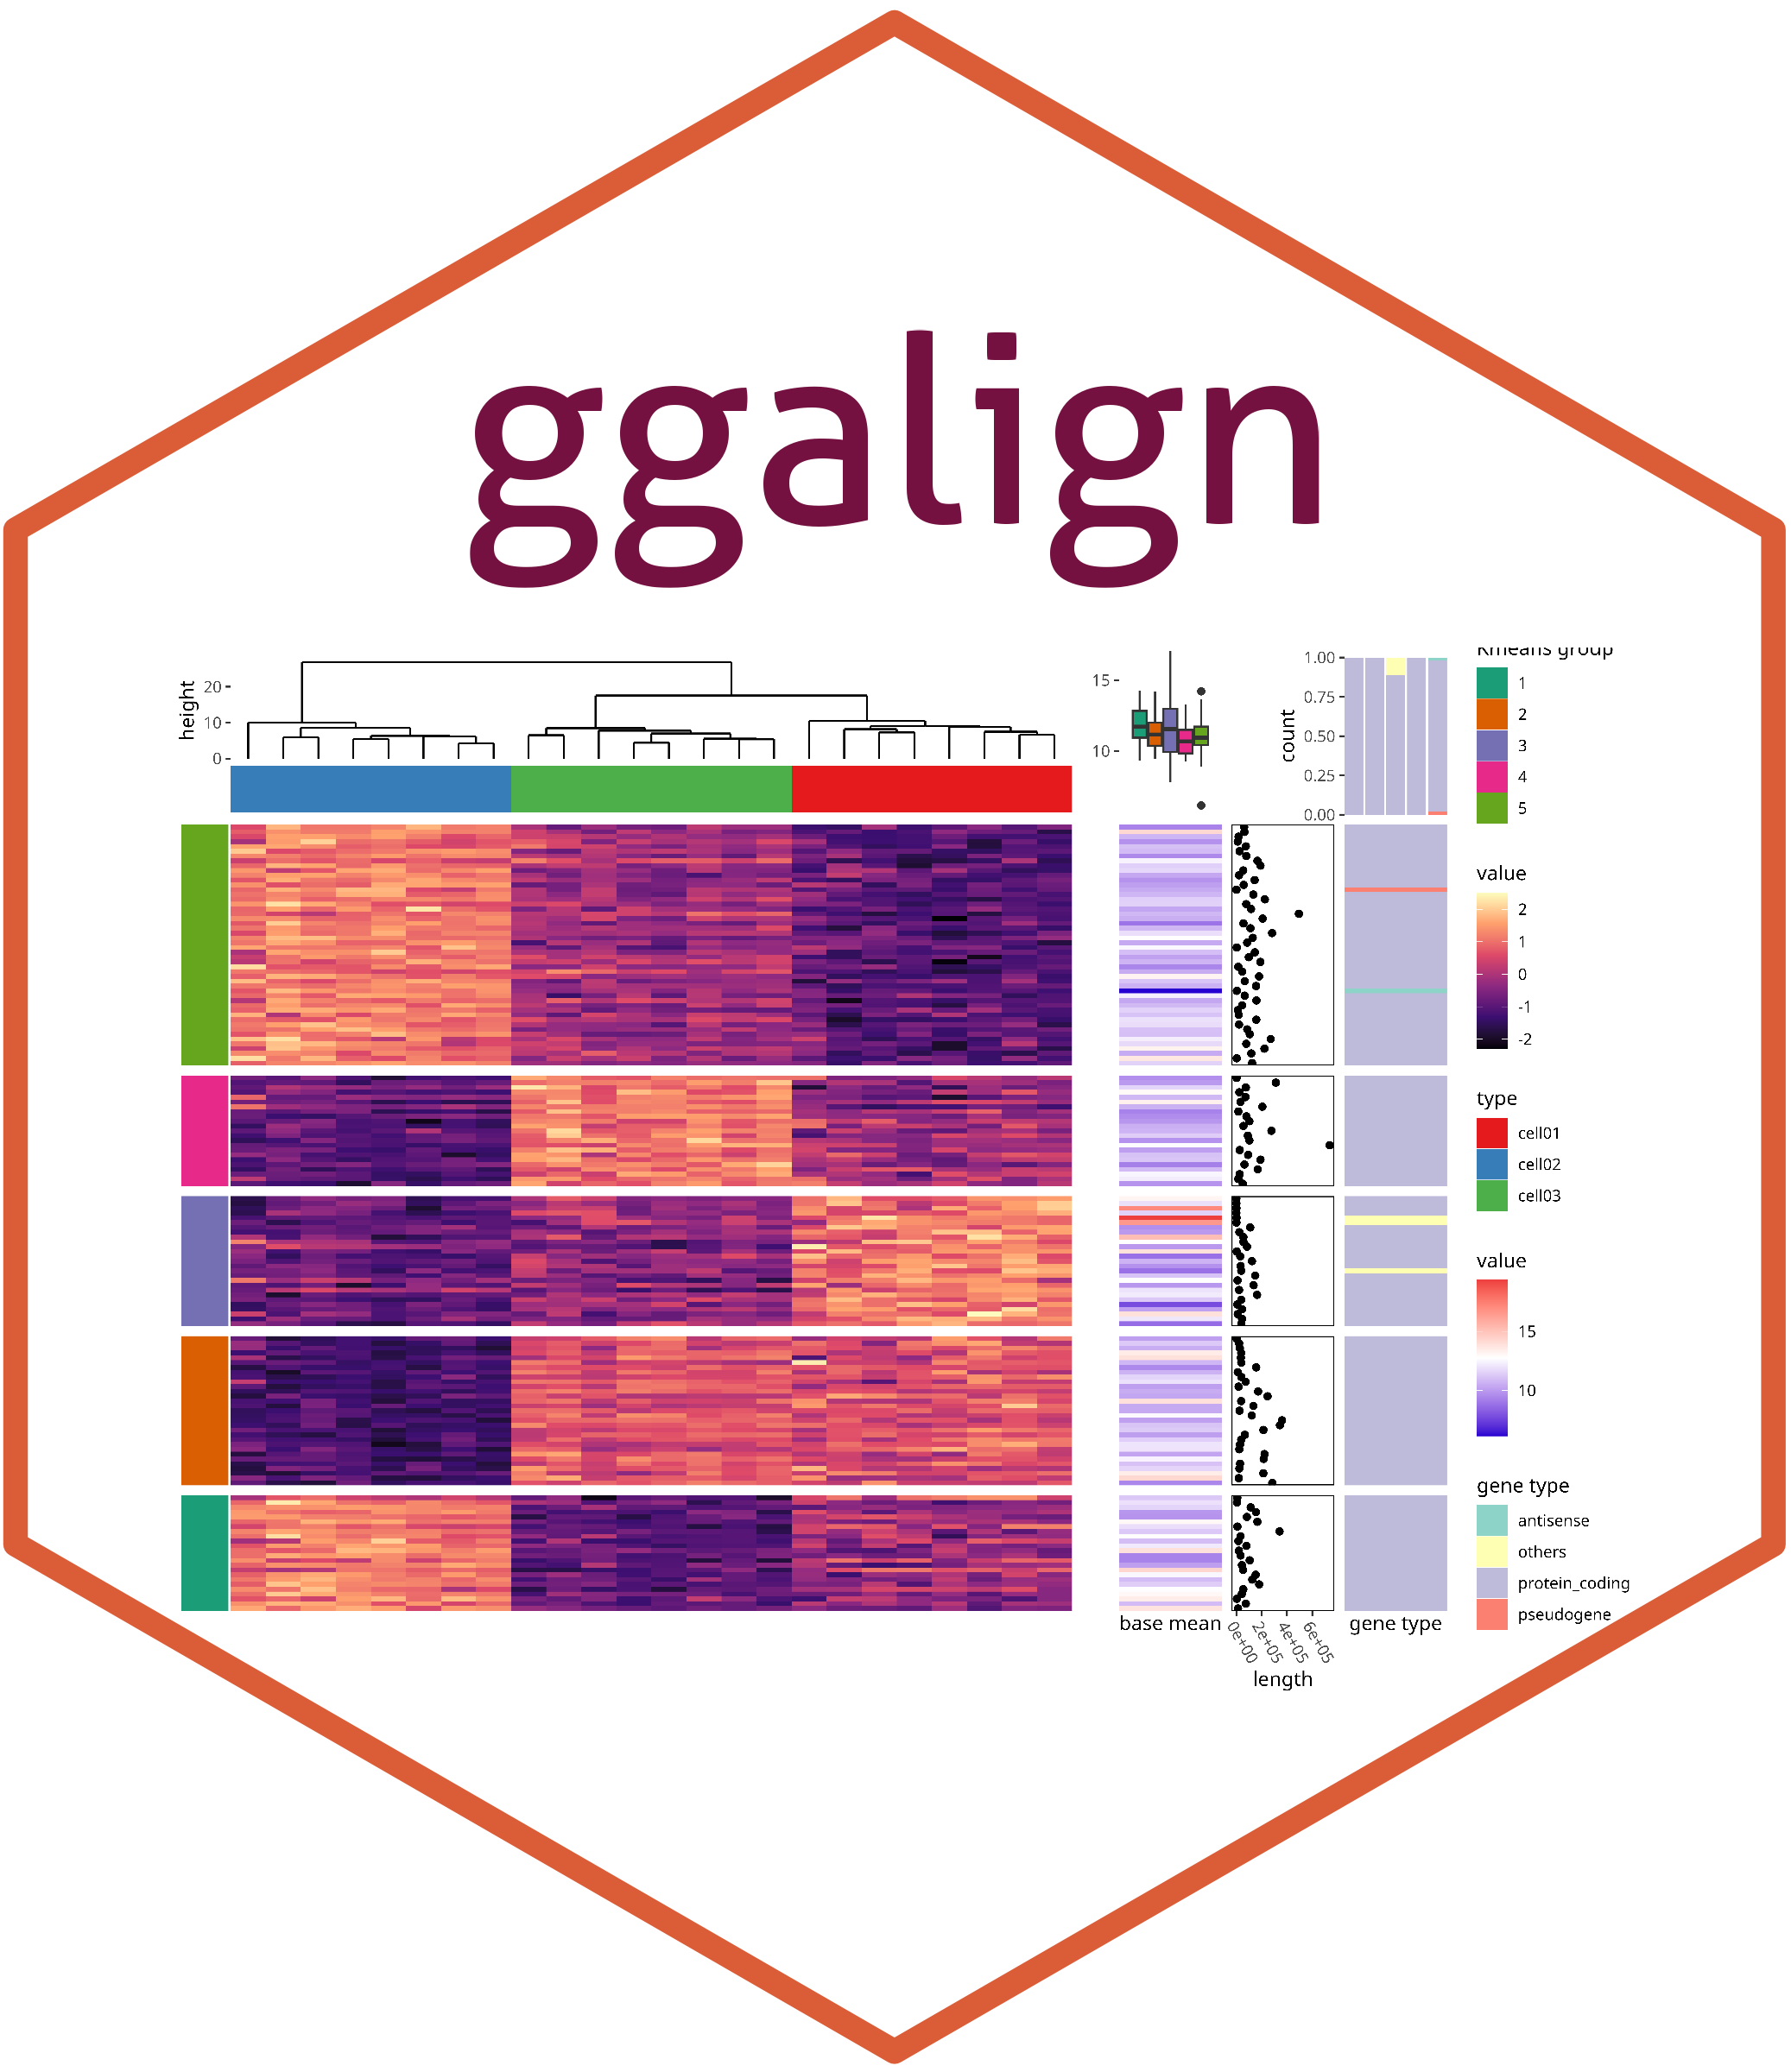
![]()
![]()

![]()
![]()
The ggalign package provides an integrative framework for composable visualization, enabling the construction of complex multi-plot layouts—including insets, circular arrangements, and multi-panel compositions. Built on the grammar of graphics, it introduces tools to align, stack, and nest plots, making it easy to link related views, overlay clustering results, or highlight shared patterns. Designed for high-dimensional data contexts such as genomics, transcriptomics, and microbiome studies, it simplifies the creation of richly annotated, publication-ready figures from diverse visual components.
Why use ggalign?
ggalign focuses on aligning observations across multiple plots. If you’ve ever struggled with aligning plots with self-contained ordering (like dendrogram), or applying consistent grouping or ordering across multiple plots (e.g., with k-means clustering), ggalign is designed to make this easier. The package integrates seamlessly with ggplot2, providing the flexibility to use its geoms, scales, and other components for complex visualizations.
Installation
You can install ggalign from CRAN using:
install.packages("ggalign")
Alternatively, install the development version from r-universe with:
install.packages("ggalign",
    repos = c("https://yunuuuu.r-universe.dev", "https://cloud.r-project.org")
)
or from GitHub with:
# install.packages("remotes")
remotes::install_github("Yunuuuu/ggalign")
Learning ggalign
- Full reference documentation: https://yunuuuu.github.io/ggalign/
- Complete tutorial book: https://yunuuuu.github.io/ggalign-book/
- Gallery of examples: https://yunuuuu.github.io/ggalign-gallery/
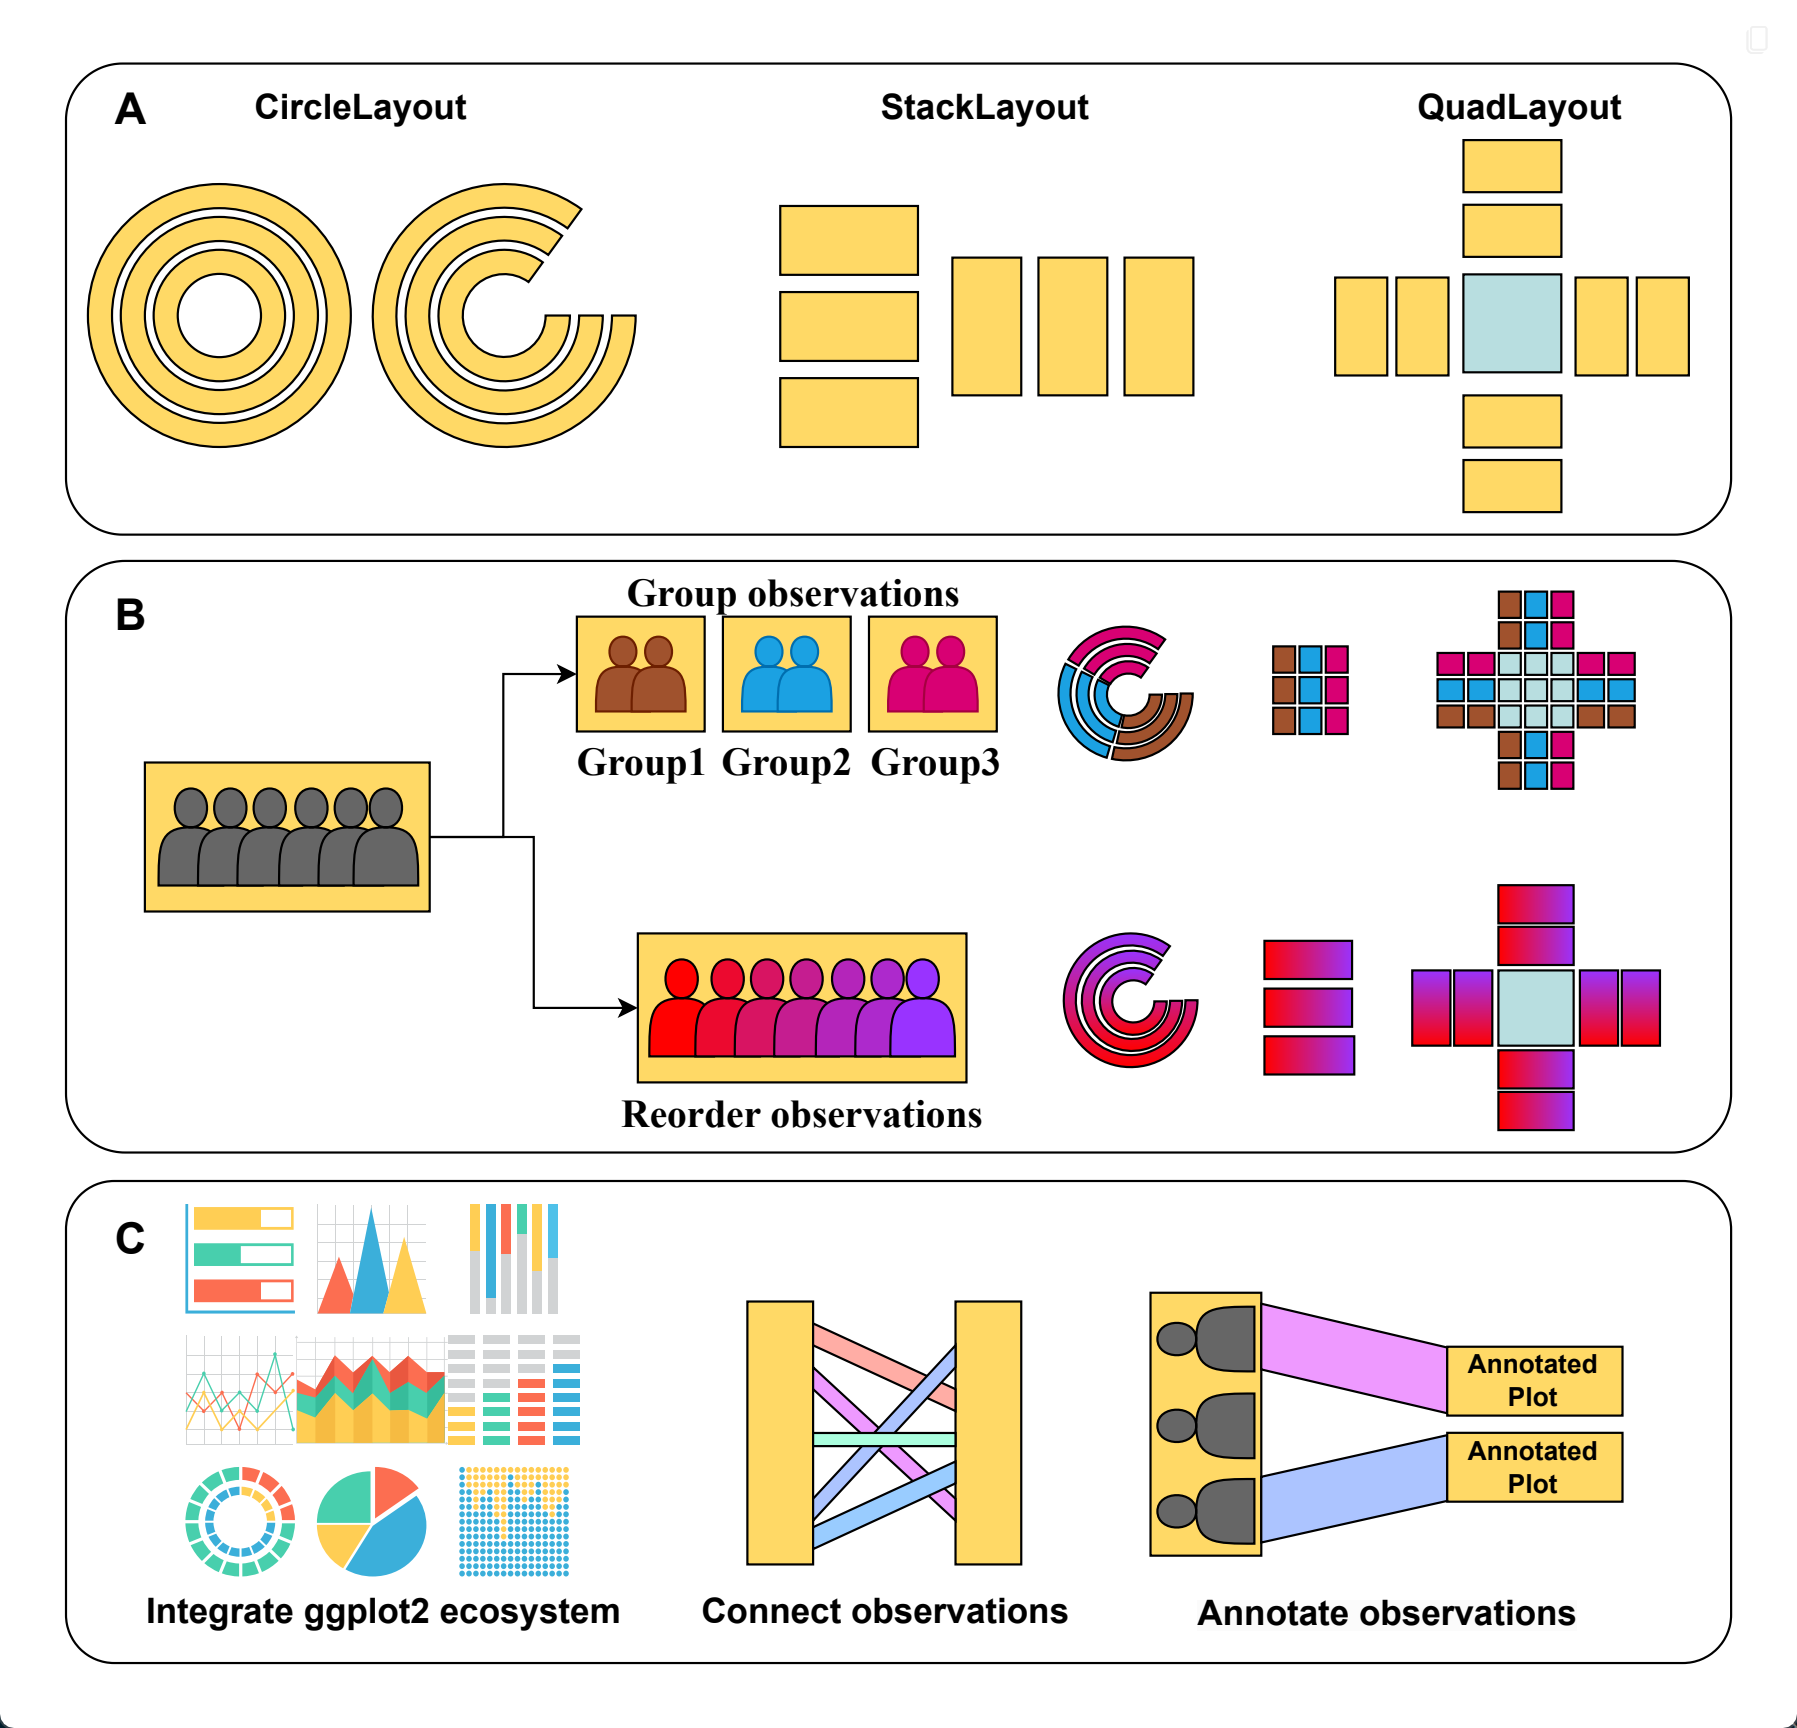
Design features
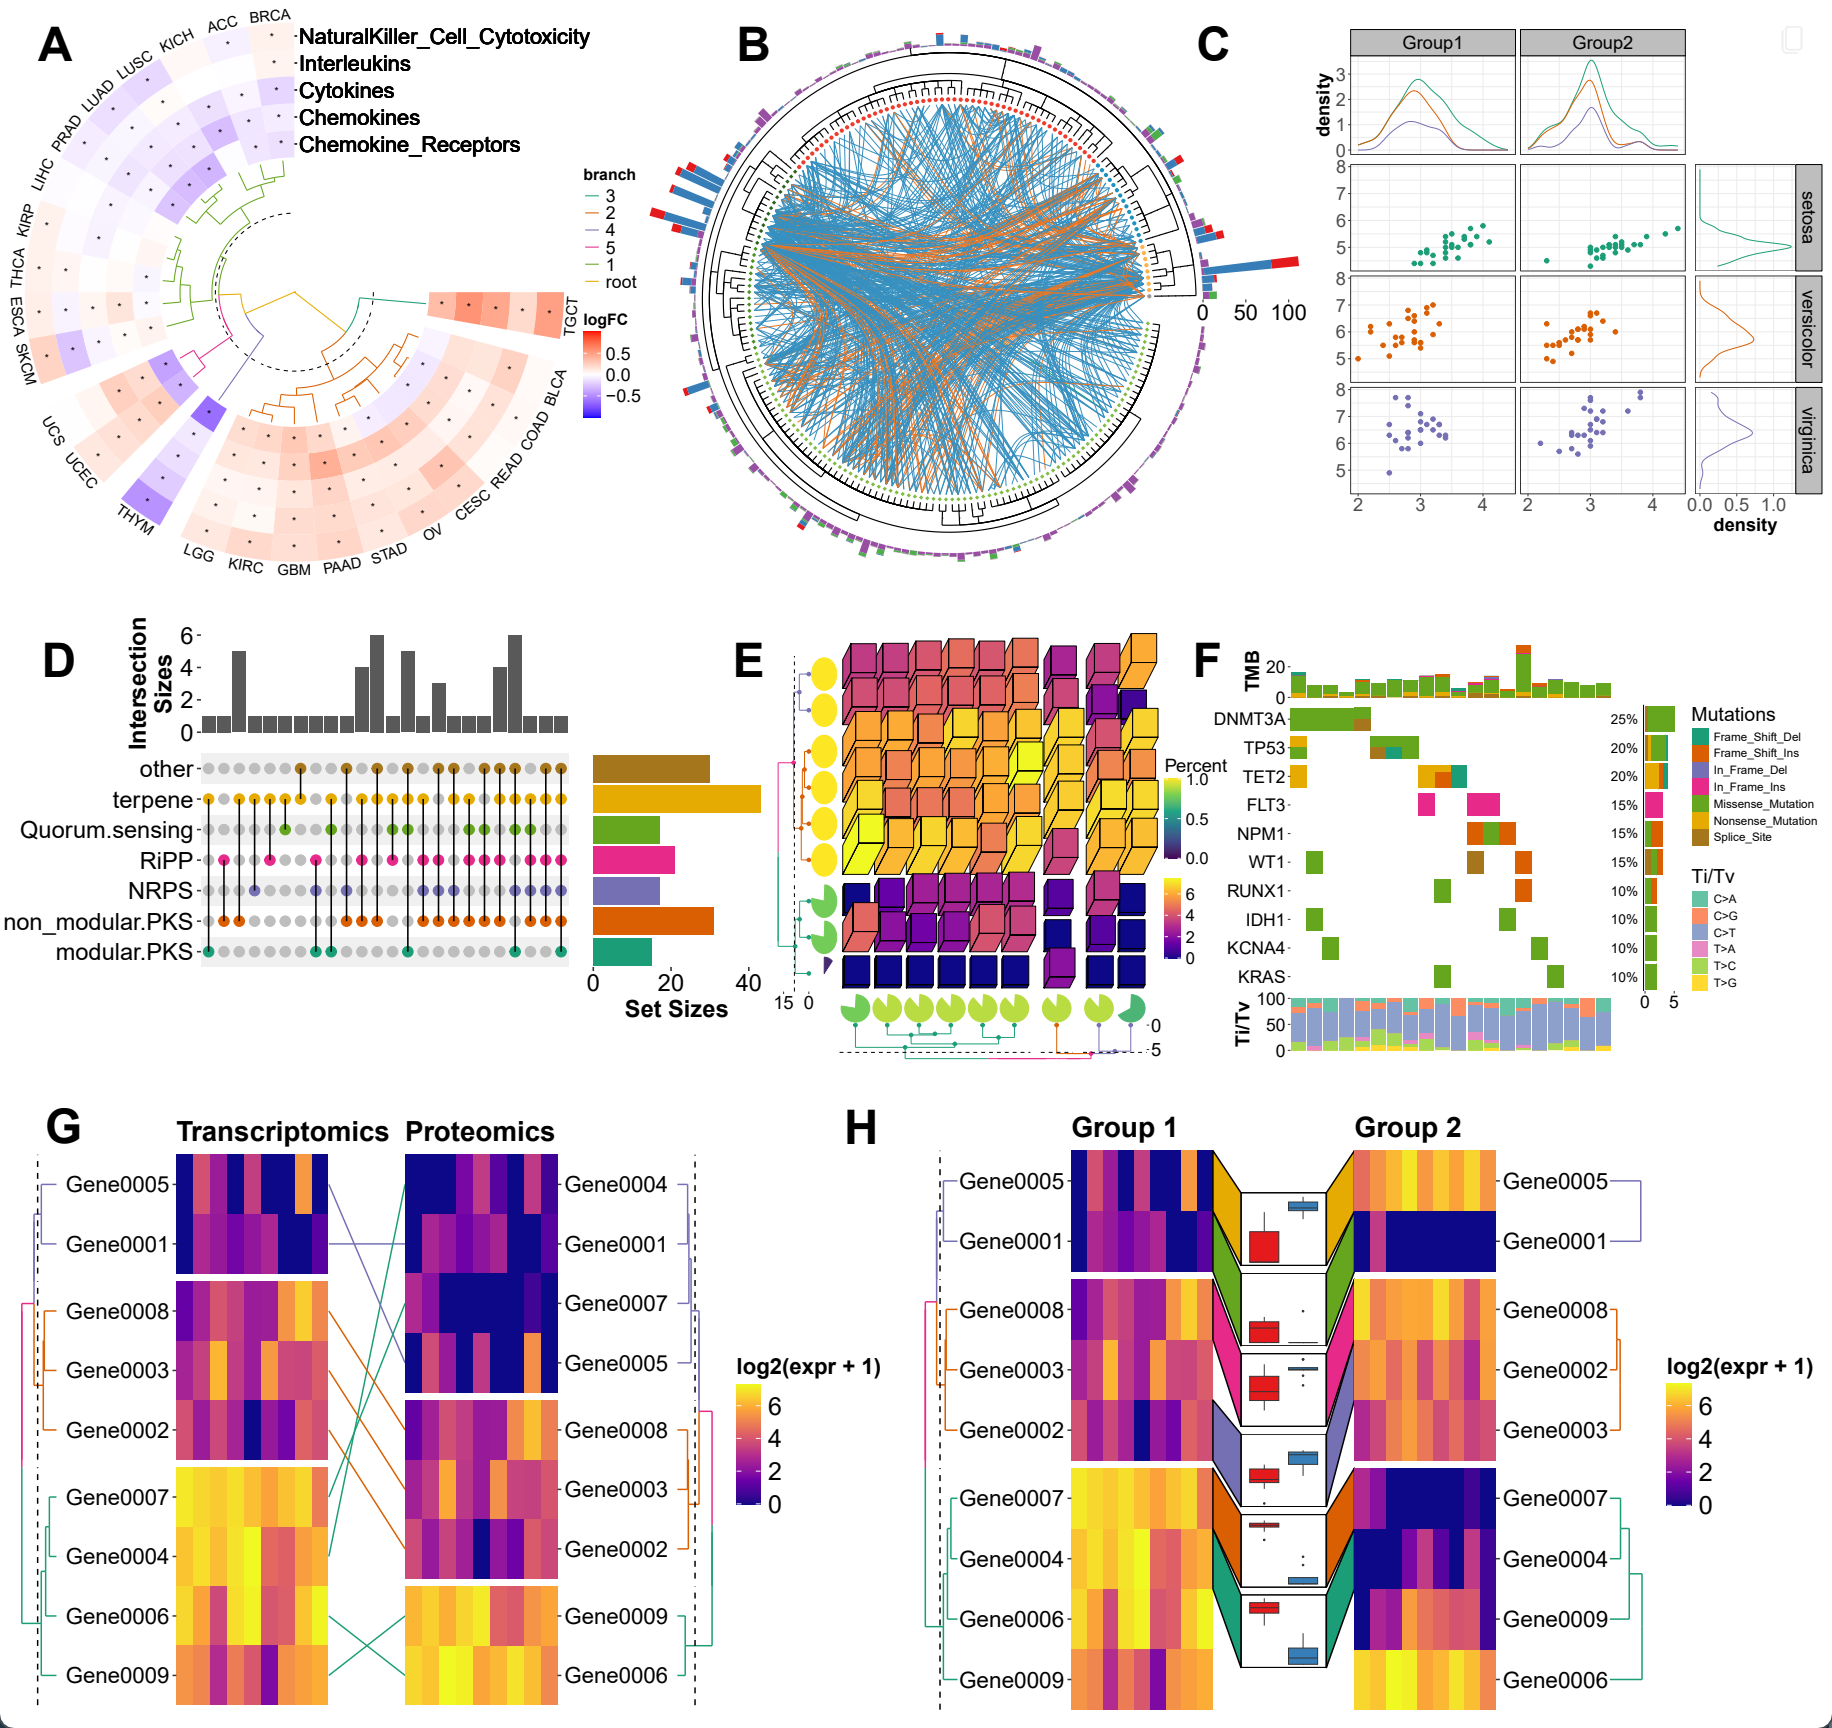
Examples
Comparison with other composable visualization tools
ggalign | marsilea | ComplexHeatmap | ||
|---|---|---|---|---|
| Language | R | Python | R | |
| User Interface | Declarative | Declarative | Functional | |
| Plot System | ggplot2 (Advanced plot system built on grid system) | Matplotlib | grid | |
| Focus | General-purpose composable visualization | Grid-based composable visualization | Heatmap | |
| StackLayout | ✅ | ✅ | ✅ | |
| QuadLayout | ✅ | ✅ | Heatmap Only (discrete variables) | |
| CircleLayout | ✅ | ❌ | ❌ | |
| Relationship | One-to-One | ✅ | ✅ | ✅ |
| One-to-Many/Many-to-One | ✅ | ❌ | ❌ | |
| Many-to-Many | ✅ | ❌ | ❌ | |
| Crosswise | ✅ | ❌ | ❌ | |
| Annotate observations | ✅ | ❌ | ✅ | |
| Fully Compatible with ggplot2 | ✅ | ❌ | ❌ | |
Feature and specification comparison
| Specification | ggalign | marsilea | ComplexHeatmap |
|---|---|---|---|
| Reorder observations | ✅ | ✅ | Heatmap Only |
| Group observations into different panels | ✅ | ✅ | Heatmap Only |
| Clustering algorithm | Kmeans,Hierarchical Clustering and arbitary algorithm | ❌ | Kmeans,Hierarchical Clustering and arbitary algorithm |
| Legends Creation | Automatic | Automatic | Limited automatic, requires manual add |
| Legends Position | Anywhere; independently controllable per plot | Anywhere | Fixed to one of four sides |
| Dendrogram | Tree from both hclust or ape | hclust only | hclust only |
| Tanglegram | ✅ | ❌ | ❌ |
| 3D Heatmap | ✅ | ❌ | ✅ |
| Oncoplot | ✅ | ✅ | ✅ |
| UpSet plot | ✅ | ✅ | ✅ |
Acknowledgements
I would like to express my sincere gratitude to the contributors of the ggplot2 project for providing a powerful and flexible framework for data visualization in R. Their work laid the foundation for the functionality and design of this package. I would also like to thank the patchwork project, from which the core coding for the plot composer was adapted. The patchwork library provided a useful mechanism for combining and aligning plots, which was modified to suit the needs of this package. Without the contributions of these open-source projects, this package would not have been possible.
Additionally, I would like to extend my heartfelt thanks to @teunbrand, who has fulfilled my numerous feature requests, and assisted with the integration of new functions into ggplot2.