

Add Arrows, Labels, and Change Annotations to 'ggplot2' Charts.
ggmemo 

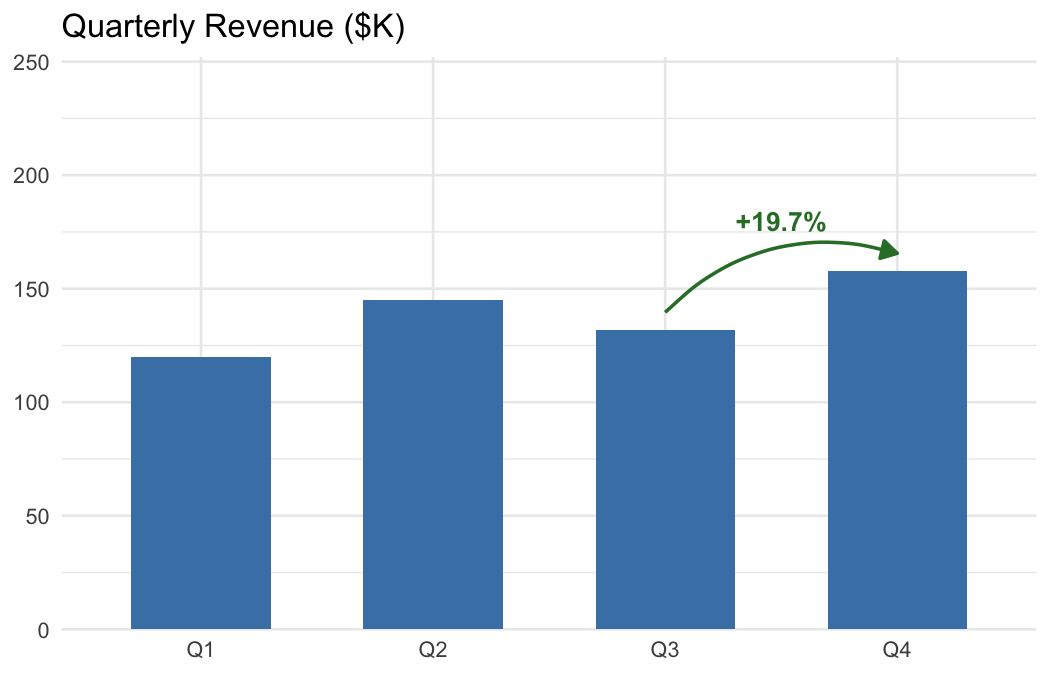
Add arrows, labels, and change annotations to ggplot2 business charts in one line of code.
Overview
| You want to… | Use |
|---|---|
| Point at a data point with an arrow and label | annotate_callout(data, where = year == 2024, label = "Peak") |
| Show percent change between two rows | annotate_change(data, from = ..., to = ..., value = sales) |
| Show absolute difference | annotate_change(..., format = "absolute") |
| Show change in percentage points | annotate_change(..., format = "points") |
| Use custom colors | annotate_change(..., colors = c(up = "#1B9E77", down = "#D95F02", flat = "#999")) |
Without ggmemo, annotating a ggplot2 chart means hardcoding coordinates, computing deltas, formatting labels, and choosing colors — roughly 10 lines of manual work per annotation. ggmemo replaces that with a single function call.
Installation
# install.packages("pak")
pak::pak("lindsay-lintelman/ggmemo")
Examples
Charts below are rendered at 7 × 4.5 in, 150 dpi.
Callout annotation
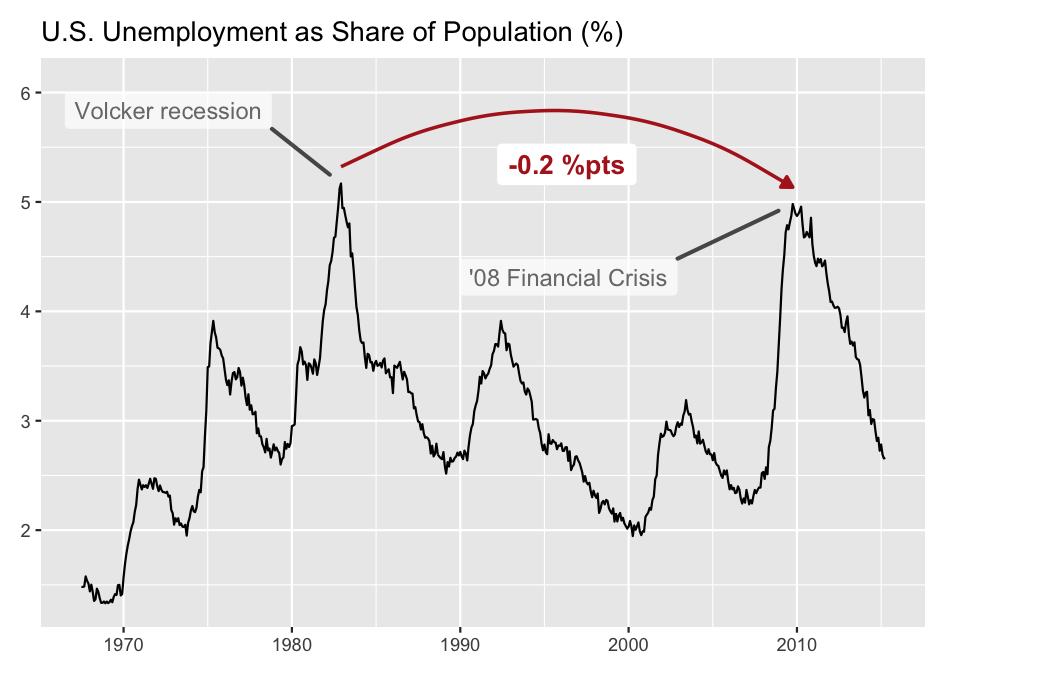
Point at a specific data row with an arrow and label:
library(ggplot2)
library(ggmemo)

# fig.width = 7, fig.height = 4.5, dpi = 150
econ <- economics
econ$unemp_rate <- econ$unemploy / econ$pop * 100

ggplot(econ, aes(x = date, y = unemp_rate)) +
  geom_line() +
  annotate_callout(
    econ,
    where = date == as.Date("1982-12-01"),
    label = "Volcker recession",
    position = "top-right",
    nudge = c(-1500, 0.5),
    arrow = NULL,
    point.padding = 2,
    alpha = .7
  ) +
  annotate_callout(
    econ,
    where = date == as.Date("2009-10-01"),
    label = "'08 Financial Crisis",
    position = "bottom-right",
    nudge = c(-2500, 0.5),
    arrow = NULL,
    point.padding = 2,
    alpha = .7
  ) +
  annotate_change(
    econ,
    from = date == as.Date("1982-12-01"),
    to = date == as.Date("2009-10-01"),
    value = unemp_rate,
    arrow_size = .08,
    arrow_type = "closed",
    curvature = -.3,
    format = "points"
  ) +
  scale_y_continuous(expand = expansion(mult = c(0.05, 0.15))) +
  labs(title = "U.S. Unemployment as Share of Population (%)",
       x = NULL, y = NULL) +
  theme(plot.margin = margin(10, 60, 10, 10))
Time series change
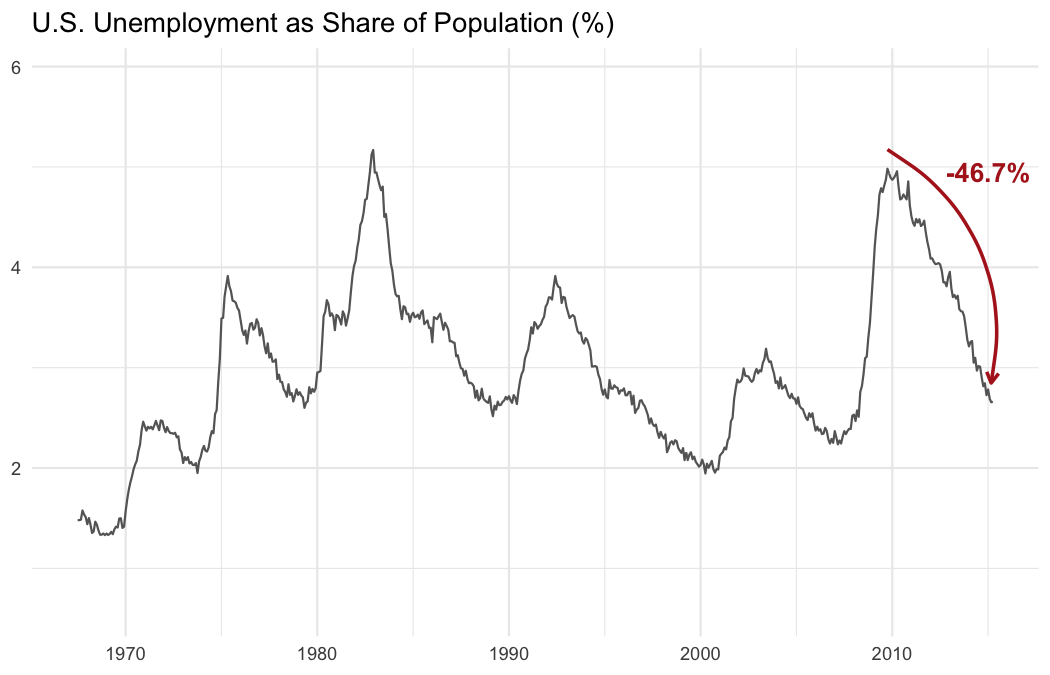
Show the delta between two data points with a color-coded arrow:
# fig.width = 7, fig.height = 4.5, dpi = 150
econ <- economics
econ$unemp_rate <- econ$unemploy / econ$pop * 100

ggplot(econ, aes(x = date, y = unemp_rate)) +
  geom_line(colour = "grey40") +
  annotate_change(
    econ,
    from = date == as.Date("2009-10-01"),
    to = date == as.Date("2015-03-01"),
    value = unemp_rate,
    arrow_pad = 0.05,
    curvature = -.35,
    arrow_size = 0.08,
    x = as.Date("2015-01-01"),
    y = 4.95,
    fill = NA
  ) +
  labs(title = "U.S. Unemployment as Share of Population (%)",
       x = NULL, y = NULL) +
  theme_minimal()
Learning more
vignette("narrating-business-charts")— full walkthrough with customization, multiple annotations, and common mistakes.?annotate_calloutand?annotate_change— function reference with all arguments and examples.
Related packages
ggmemo is focused on callout and change annotations for business charts. For other annotation needs:
- ggpp — precise annotation positioning with NPC coordinates. ggmemo is built on ggpp.
- ggrepel — automatically reposition text labels to avoid overlaps.
- ggannotate — interactively annotate plots in RStudio.
Code of Conduct
Please note that the ggmemo project is released with a Contributor Code of Conduct. By contributing to this project, you agree to abide by its terms.