Description
Pie, Donut and Rose Pie Plots.
Description
Create pie, donut and rose pie plot with 'ggplot2'.
README.md
ggpie - A ggplot2 extension to create pie, donut and rose pie plot

Introduction
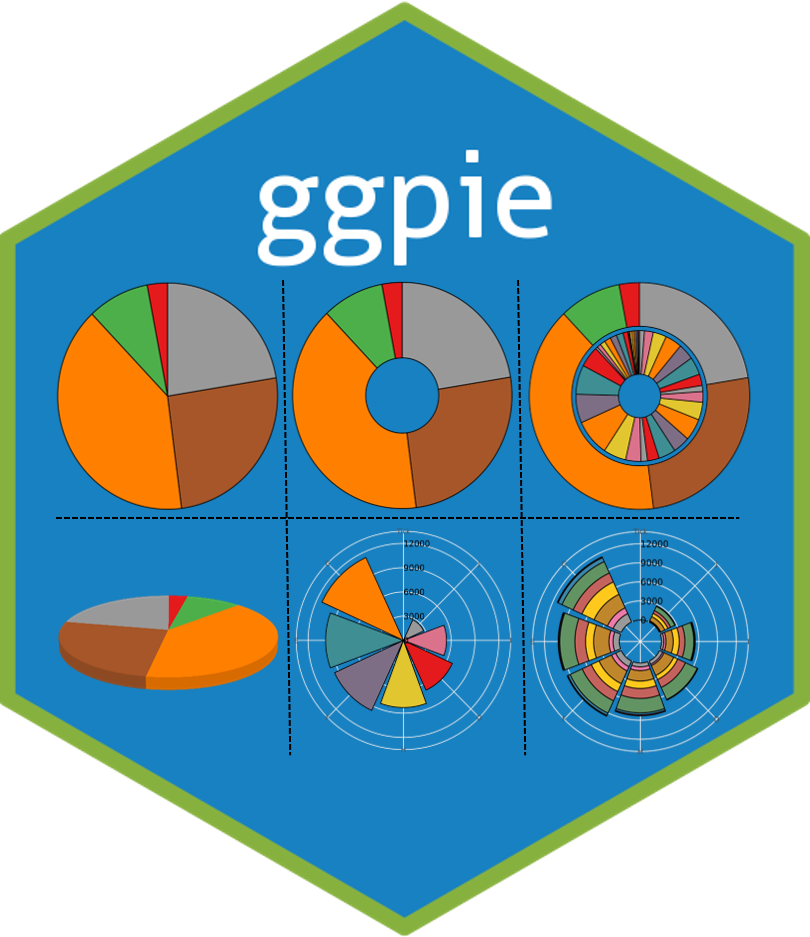
ggpie aims to create pie (2D and 3D), donut and rose pie plot with the ggplot2 plotting system which implemented the grammar of graphics. It contains five main functions:
ggpie: Create 2D pie plot with single group variable.ggdonut: Create 2D donut plot with single group variable.ggnestedpie: Create 2D nested pie plot with two group variables.ggpie3D: Create 3D pie plot with single group variable.ggrosepie: Create rose pie plot with single or two group variables.
Installation
You can install the released version of ggpie from CRAN with:
install.packages("ggpie")
Or install the package via the Github repository:
# install.package("remotes")   #In case you have not installed it.
remotes::install_github("showteeth/ggpie")
In general, it is recommended to install from Github repository (update more timely).
Citation
citation("ggpie")
#>
#> To cite ggpie in publications use:
#>
#>   Yabing Song (2022). ggpie: Create Pie, Donut and Rose Pie Plot with
#>   'ggplot2'. R package version 0.2.2.
#>   https://CRAN.R-project.org/package=ggpie
#>
#> A BibTeX entry for LaTeX users is
#>
#>   @Manual{,
#>     title = {ggpie: Create Pie, Donut and Rose Pie Plot with 'ggplot2'.},
#>     author = {Yabing Song},
#>     note = {R package version 0.2.2},
#>     year = {2022},
#>     url = {https://CRAN.R-project.org/package=ggpie},
#>   }
Contributing
Please note that the ggpie project is released with a Contributor Code of Conduct. By contributing to this project, you agree to abide by its terms.

