Description
Ragged Grids for 'ggplot2'.
Description
Extend 'ggplot2' facets to panel layouts arranged in a grid with ragged edges. facet_ragged_rows() groups panels into rows that can vary in length, facet_ragged_cols() does the same but for columns. These can be useful, for example, to represent nested or partially crossed relationships between faceting variables.
README.md
ggragged 
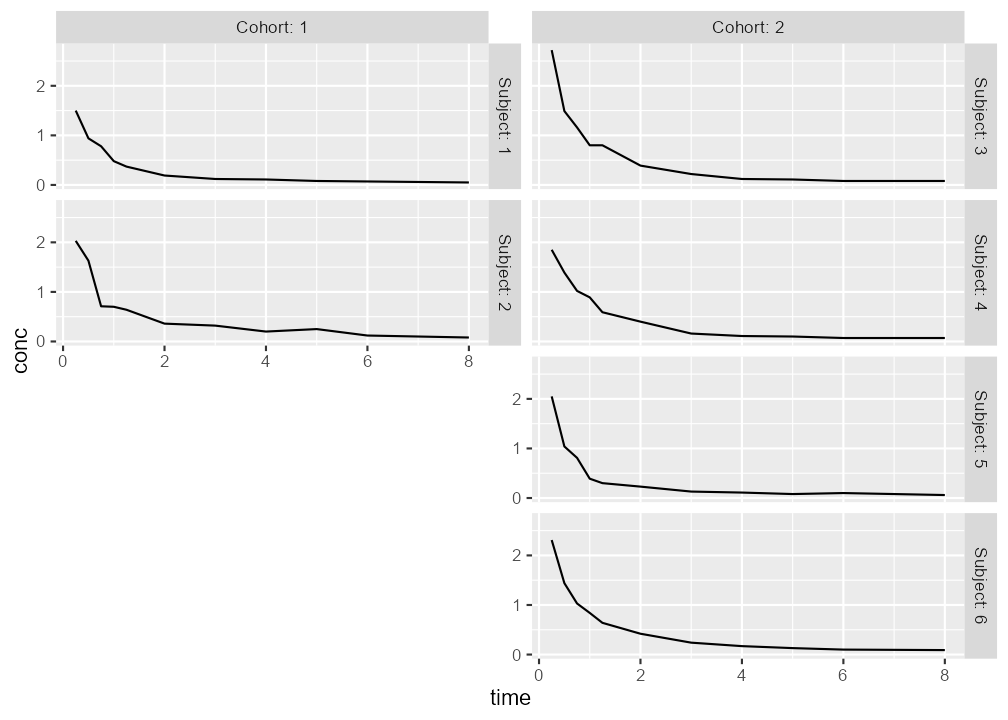
ggragged extends the faceting system in ggplot2 to ragged grids—a hybrid layout between facet_wrap() and facet_grid().
facet_ragged_rows()groups panels into rows that can vary in length.facet_ragged_cols()groups panels into columns that can vary in length.
Installation
Install the current release from CRAN:
install.packages("ggragged")
Or the development version from GitHub:
remotes::install_github("mikmart/ggragged")
Example
Ragged grids can be used to clearly separate nested hierarchies in the panel layout:
library(ggplot2)
library(ggragged)

p <- ggplot(mpg, aes(displ, cty)) + geom_point()
p + facet_ragged_rows(vars(drv), vars(cyl))

p + facet_ragged_cols(vars(cyl), vars(drv))

