Nonparametric Assessment Between Competing Risks Hazard Ratios.
hrcomprisk: Nonparametric Assessment of Differences Between Competing Risks Hazards
This package aims to estimate Nonparametric Cumulative-Incidence Based Estimation of the Ratios of Sub-Hazard Ratios to Cause-Specific Hazard Ratios.
Installation
You can install the latest version of hrcomprisk in CRAN or the development version from Github:
# Install hrcomprisk from CRAN
install.packages("hrcomprisk")
# Or the development version from GitHub:
# install.packages("devtools")
devtools::install_github("AntiportaD/hrcomprisk")
Using a formatted data set to apply the hrcomprsk package
You can use the dataset provided by the authors from the CKiD study, wich has the necessary variables to run the package.
library(hrcomprisk)
data <- hrcomprisk::dat_ckid
dim(data) #dimensions
#> [1] 626  13
names(data) #variable names
#>  [1] "b1nb0"        "event"        "male1fe0"     "incomelt30"   "incomegt75"
#>  [6] "lps"          "foodassist"   "public"       "matedultcoll" "privatemd"
#> [11] "entry"        "exit"         "inckd"
The package will create a data.frame object with the cumulative incidence of each competing risk for each exposure group. We can use the CRCumInc fuction.
mydat.CIF<-CRCumInc(df=data, time=exit, event=event, exposed=b1nb0, print.attr=T)
#> $names
#>  [1] "event"       "exposure"    "time"        "CIoinc_comp" "CIxinc_comp"
#>  [6] "CIoinc_1"    "CIxinc_1"    "CIoinc_2"    "CIxinc_2"    "R1"
#> [11] "R2"
#>
#> $class
#> [1] "data.frame"
Using a the output to create Plots of CIFs and the Ratio of Hazard Ratios (Rk)
We can also obtain two different plots using the plotCIF function:
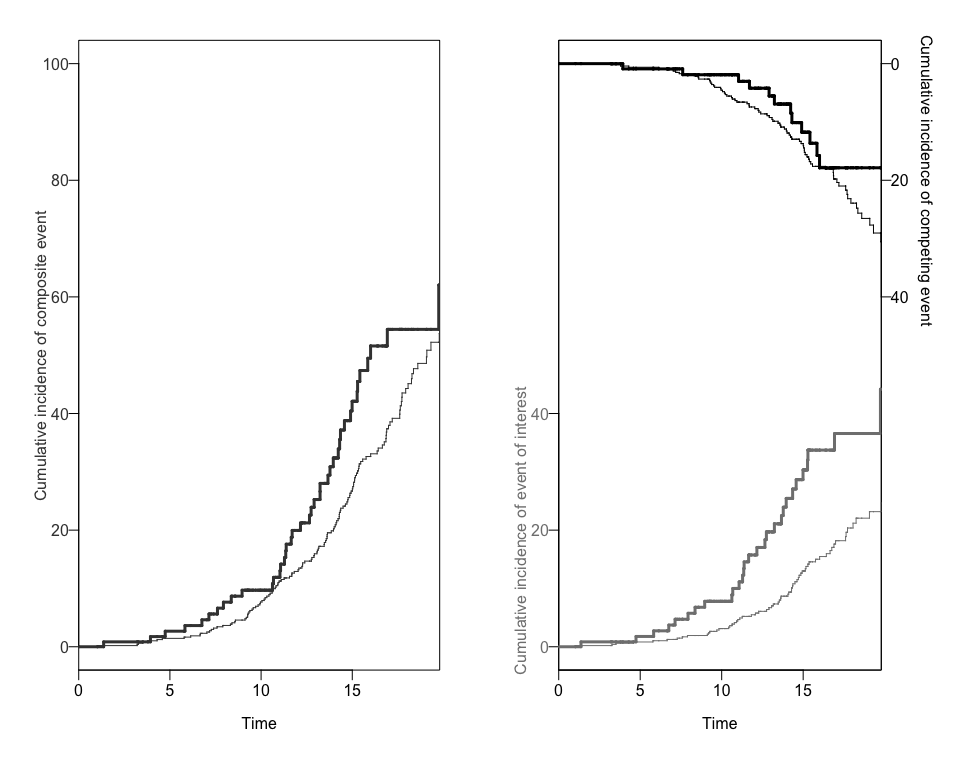
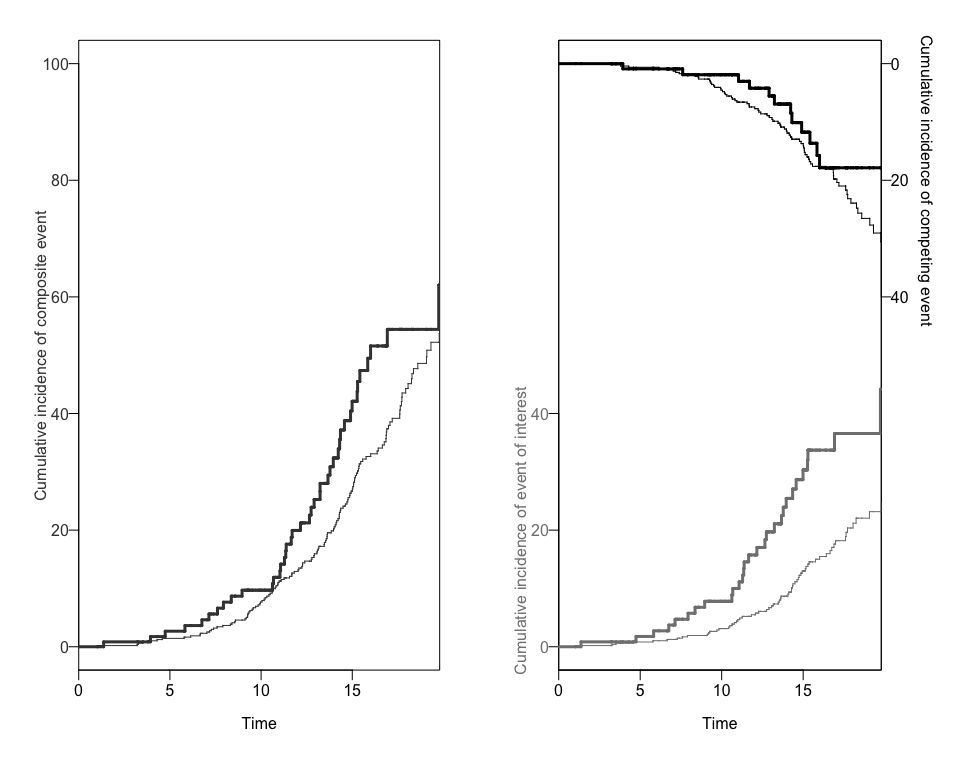
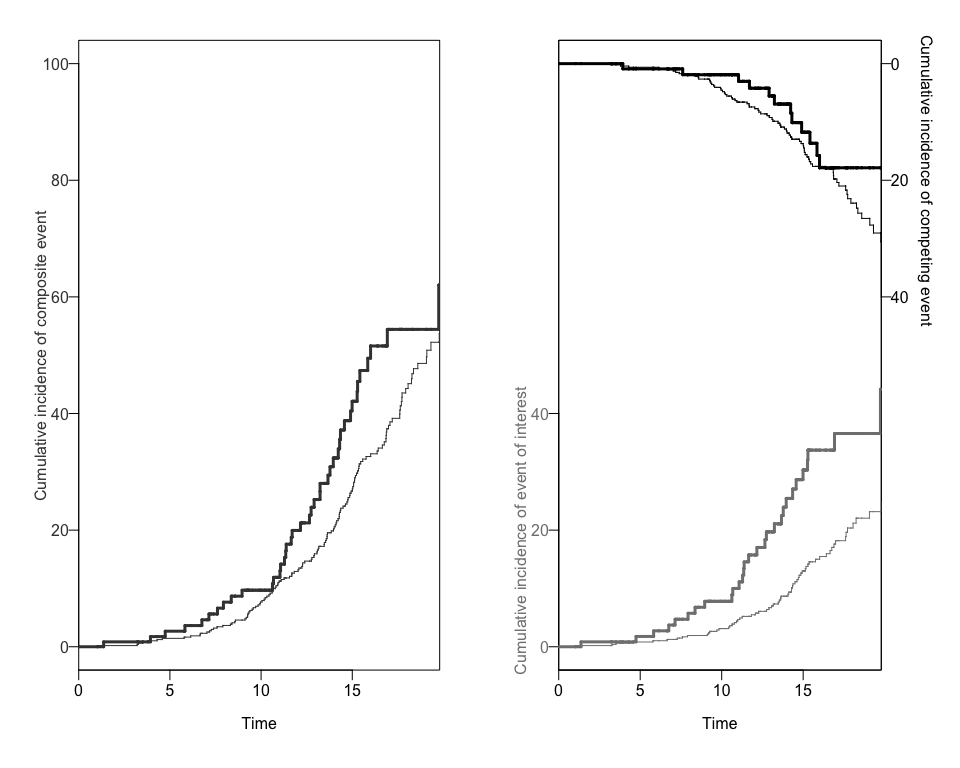
- The Cumulative Incidence of both events of interest, overall and by exposure level, and
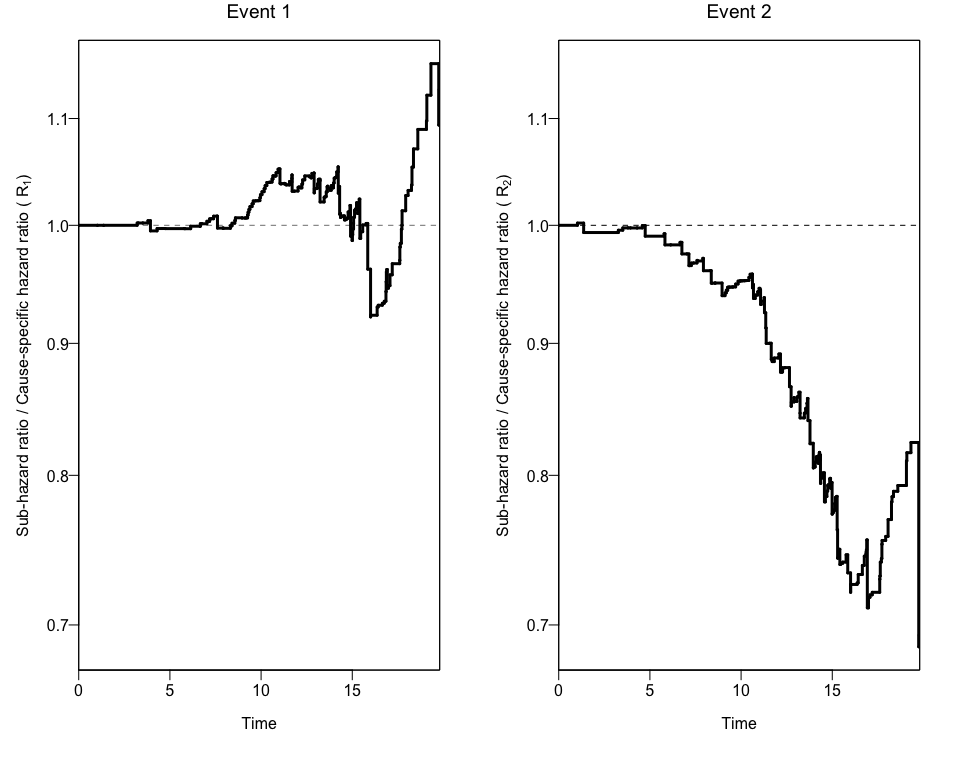
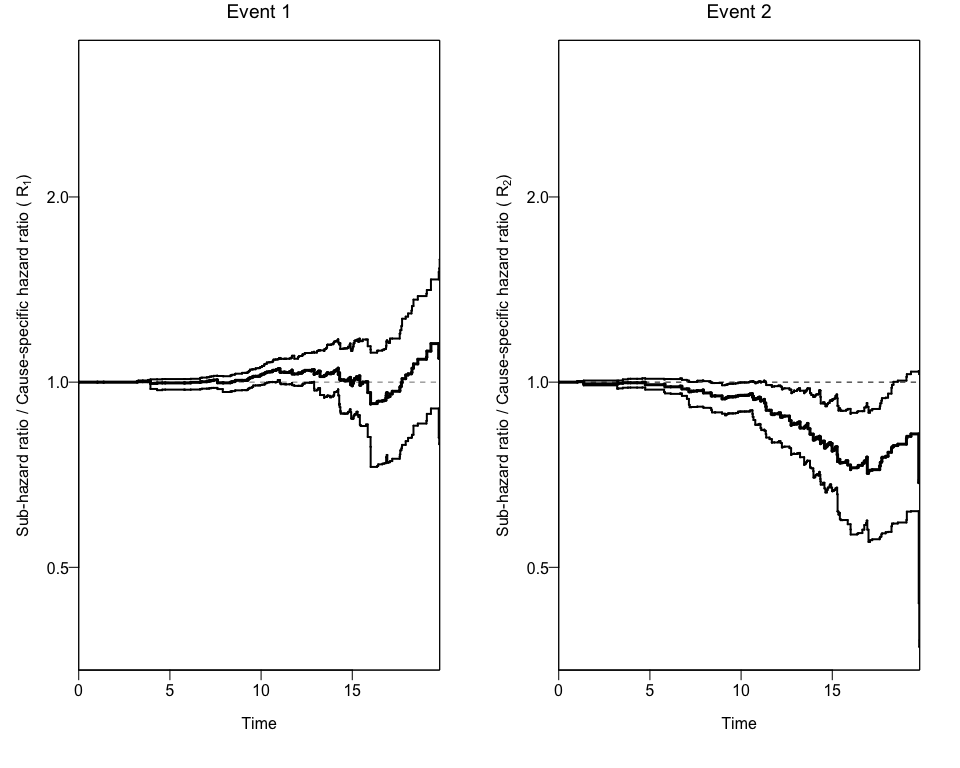
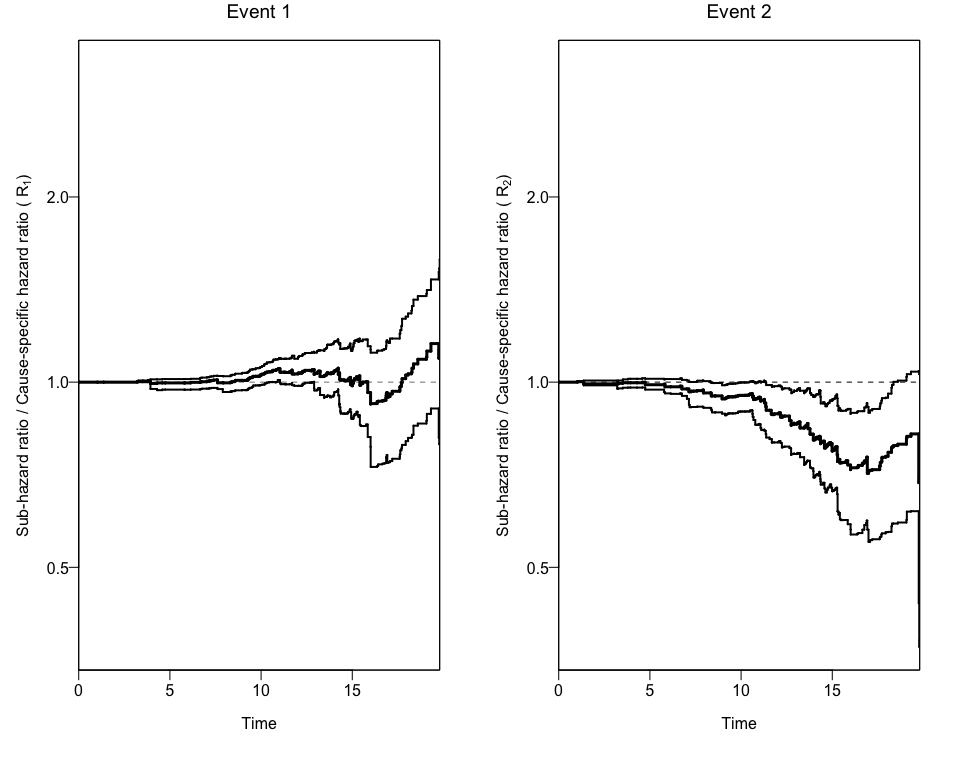
- The ratios of Hazard ratios (sub-distribution Hazard Ratio and cause-specific Hazard Ratio) by event.
plots<-plotCIF(cifobj=mydat.CIF, maxtime = 20, eoi = 1)
Bootstrapping the data to get 95% Confidence Intervals for the Ratio of Hazard Ratios (Rk)
In order to get confidence intervals to the ratio of Hazard Ratios (Rk), we can use the bootCRCumInc function:
ciCIF<-bootCRCumInc(df=data, exit=exit, event=event, exposure=b1nb0, rep=100, print.attr=T)
#> $names
#> [1] "R1.lower" "R1.upper" "R2.lower" "R2.upper"
#>
#> $class
#> [1] "data.frame"
Finally, we can use this new data to add the 95% Confidence Intervals to the previous plot using again the plotCIF function.
plotCIF(cifobj=mydat.CIF, maxtime= 20, ci=ciCIF)
The wrapper function npcrest
The package also offers a wrapper function (npcrest) to do all these analyses in one step.
npcrest(df=data, exit=exit, event=event, exposure=b1nb0,rep=100, maxtime=20, print.attr=T)
#> $names
#>  [1] "event"       "exposure"    "time"        "CIoinc_comp" "CIxinc_comp"
#>  [6] "CIoinc_1"    "CIxinc_1"    "CIoinc_2"    "CIxinc_2"    "R1"
#> [11] "R2"
#>
#> $class
#> [1] "data.frame"
#>
#> $names
#> [1] "R1.lower" "R1.upper" "R2.lower" "R2.upper"
#>
#> $class
#> [1] "data.frame"
References
- Ng D, Antiporta DA, Matheson M, Munoz A. Nonparametric assessment of differences between competing risks hazard ratios: application to racial differences in pediatric chronic kidney disease progression. Clinical Epidemiology, 2020. Link to Journal
- Muñoz A, Abraham AG, Matheson M, Wada N. In: Risk Assessment and Evaluation of Predictions. Lee MLT, Gail M, Pfeiffer R, Satten G, Cai T, Gandy A, editor. New York: Springer; 2013. Non-proportionality of hazards in the competing risks framework; pp. 3–22. Google Scholar.