Description
Flood Extents and Duration along the Rivers Elbe and Rhine.
Description
Raster based flood modelling internally using 'hyd1d', an R package to interpolate 1d water level and gauging data. The package computes flood extent and duration through strategies originally developed for 'INFORM', an 'ArcGIS'-based hydro-ecological modelling framework. It does not provide a full, physical hydraulic modelling algorithm, but a simplified, near real time 'GIS' approach for flood extent and duration modelling. Computationally demanding annual flood durations have been computed already and data products were published by Weber (2022) <doi:10.1594/PANGAEA.948042>.
README.md
hydflood 
The R package hydflood is designed to compute flood extents and durations along the German federal waterways Elbe and Rhine.
Installation
hydflood is available from CRAN. To install it run:
install.packages("hydflood")
To install the latest development version from Github run:
install.packages("devtools")
library(devtools)
devtools::install_github("bafg-bund/hydflood")
Usage
The package hydflood is build around the packages terra and hyd1d.
# load the package
options("hydflood.datadir" = tempdir())
library(hydflood)
# import the raster data and create a raster stack
x <- hydSpatRaster(filename_dem = "data-raw/raster.dem.tif",
filename_csa = "data-raw/raster.csa.tif")
# create a temporal sequence
seq <- seq(as.Date("2016-12-01"), as.Date("2016-12-31"), by = "day")
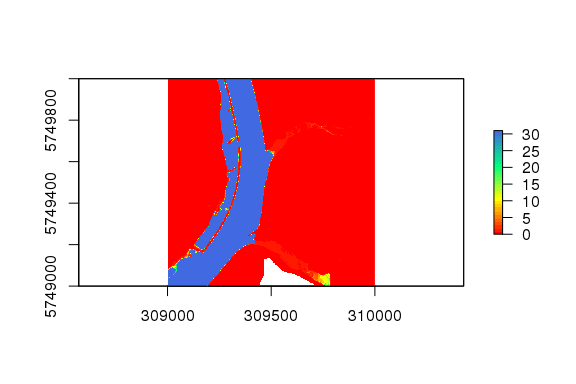
# compute a flood duration
fd <- flood3(x = x, seq = seq)
# and plot it
plot(fd)