

Japan Maps with Insets for Okinawa and Ogasawara.
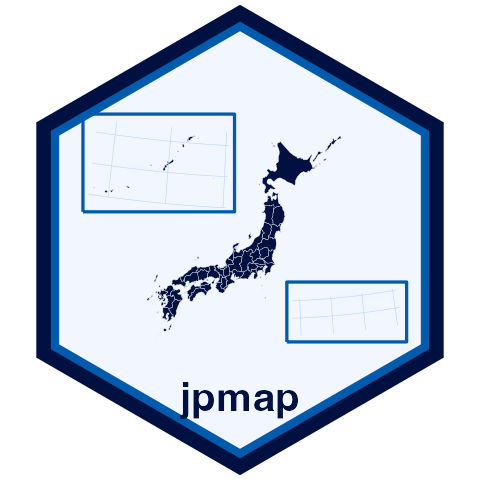

jpmap: Japan maps with visible island insets
jpmap is an R package for drawing maps of Japan with an API modeled after usmap.
The package is designed to be the everyday Japan-map workflow for R users: request a map, join ordinary tabular data, and publish a static or interactive figure without writing one-off GIS scripts.
Inset behavior is selectable: use inset = TRUE for both Okinawa and Ogasawara, inset = FALSE for a literal projected map, or values such as inset = "okinawa" to transport only selected island groups. You can also use okinawa = FALSE or ogasawara = FALSE. plot_jpmap() draws inset boxes by default; set inset_boxes = FALSE to remove them.
Use territorial_disputes = FALSE to exclude areas discussed in Japan territorial-dispute references, or pass a subset such as "senkaku" or "takeshima".
For website maps, jp_map_leaflet() returns a Leaflet htmlwidget using literal longitude/latitude geography.
Installation
Install the development version from GitHub:
install.packages("remotes")
remotes::install_github("yhoriuchi/jpmap")
Boundary GeoPackages are large and live outside the functionality package. Install the companion data package when you want ready-to-use boundary files, or build the files locally from MLIT source data.
remotes::install_github("yhoriuchi/jpmapdata")
Core Workflow
library(tidyverse)
library(jpmap)

plot_jpmap("prefecture")
plot_jpmap("municipality", include = "Okinawa")
plot_jpmap("prefecture", territorial_disputes = FALSE)

gdp <- jp_prefecture_gdp |>
  select(pref_code, gdp_per_capita_jpy)

jp_map("prefecture") |>
  jp_map_join(gdp, by = "pref_code")
Articles
Start with these pages:
- Introduction
- Related Packages
- Boundary Data Policy
- Download Boundary Data
- Import Boundary Data
- Transform Data
- Okinawa and Ogasawara Insets
- Interactive Web Maps with leaflet
Then use the plotting tutorials:
- Plot Prefectural Choropleth Maps
- Plot Prefectural Point Maps
- Plot Municipal Choropleth Maps
- Plot Municipal Point Maps
Transform Point Data
Use jpmap_transform() to put user-supplied longitude and latitude data into the same projected coordinate system used by plot_jpmap().
library(tidyverse)
library(jpmap)

points <- tribble(
  ~place, ~lon, ~lat,
  "Tokyo", 139.767, 35.681,
  "Naha", 127.681, 26.212,
  "Ogasawara", 142.191, 27.094
)

points |>
  jpmap_transform()
Boundary Data
jpmap looks for boundary GeoPackages in the companion jpmapdata package and in the local data directory returned by jpmap_data_dir().
After boundary data are available, draw Okinawa municipalities with:
plot_jpmap("municipality", include = "Okinawa")
You can also build boundary files locally from Japan's official MLIT National Land Numerical Information N03 administrative area data:
jpmap_build_data(year = 2024)
jpmap_build_data(year = 2024, prefecture = "Ehime")
The generated file is written to jpmap_data_dir() by default and contains two layers:
prefecturesmunicipalities
After data is available, jp_map() returns sf objects and plot_jpmap() returns ordinary ggplot2 maps. Users who already work with jpndistrict can also pass its sf output through jpmap_transform().
Example Data
Two public-source sample datasets are included:
jp_prefecture_gdp: 2021 prefecture GDP per capita values.jp_us_military_bases: selected U.S. military installations in Japan with coordinates, public approximate personnel figures where available, and row-levelsource_urllinks.