Description
'leaflet' Extensions for 'mapview'.
Description
Provides extensions for packages 'leaflet' & 'mapdeck', many of which are used by package 'mapview'. Focus is on functionality readily available in Geographic Information Systems such as 'Quantum GIS'. Includes functions to display coordinates of mouse pointer position, query image values via mouse pointer and zoom-to-layer buttons. Additionally, provides a feature type agnostic function to add points, lines, polygons to a map.
README.md
leafem - leaflet extensions for mapview
leafem provides extensions for package leaflet many of which are used by package mapview. The intention of this package is to enhance leaflet functionality to provide a more GIS-like feeling when plotting spatial data interactively.
Installation
You can install the released version of leafem from CRAN with:
install.packages("leafem")
Extensions
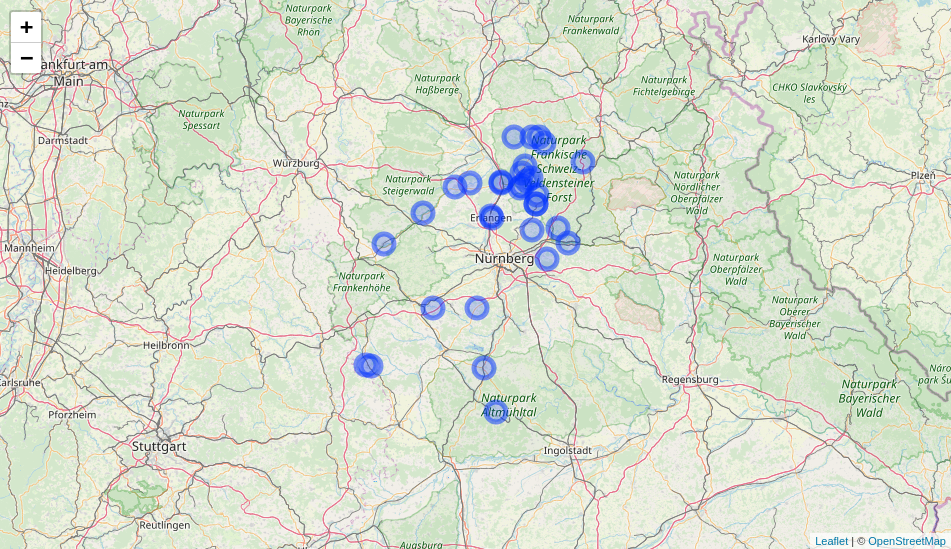
addFeatures
library(leaflet)

leaflet() %>% addProviderTiles("OpenStreetMap") %>% addFeatures(data = breweries91)
addMouseCoordinates
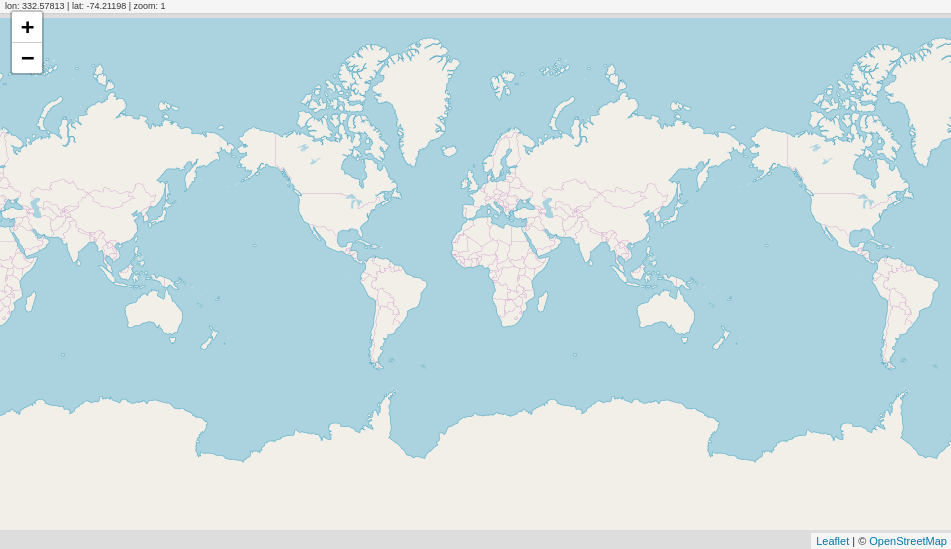
leaflet() %>%
  addProviderTiles("OpenStreetMap") %>%
  addMouseCoordinates()
garnishMap
library(leaflet)

m <- leaflet() %>% addProviderTiles("OpenStreetMap")
garnishMap(m, addMouseCoordinates)

addHomeButton
library(leaflet)
library(raster)

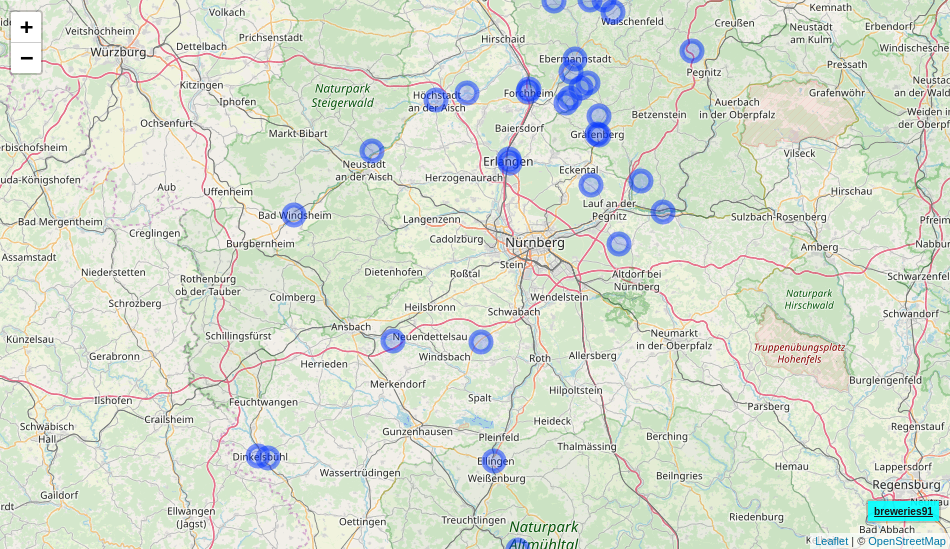
m <- leaflet() %>%
  addProviderTiles("OpenStreetMap") %>%
  addCircleMarkers(data = breweries91) %>%
  addHomeButton(extent(breweries91), "breweries91")
m
addImageQuery
library(leaflet)
library(plainview)

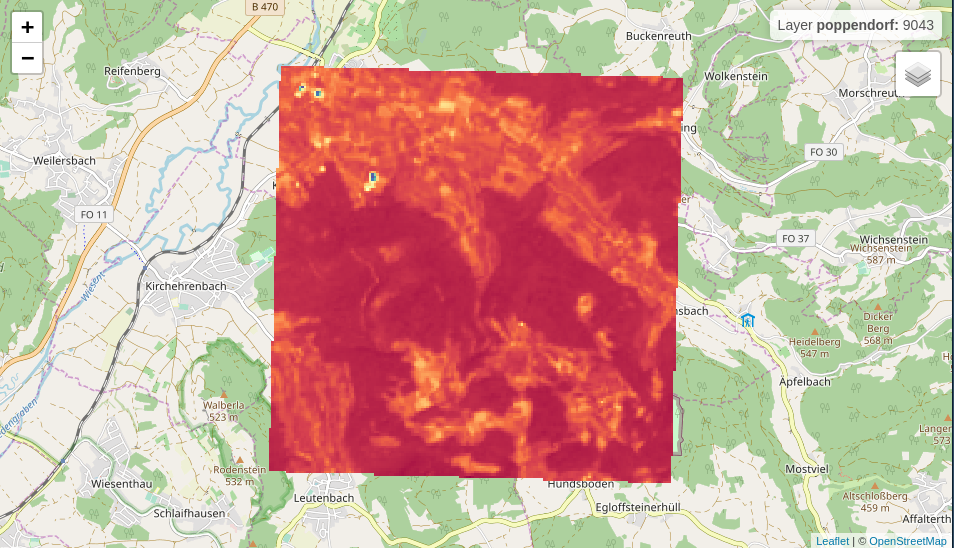
leaflet() %>%
  addProviderTiles("OpenStreetMap") %>%
  addRasterImage(poppendorf[[1]], project = TRUE, group = "poppendorf",
                 layerId = "poppendorf") %>%
  addImageQuery(poppendorf[[1]], project = TRUE,
                layerId = "poppendorf") %>%
  addLayersControl(overlayGroups = "poppendorf")
addLogo
img <- "https://www.r-project.org/logo/Rlogo.svg"

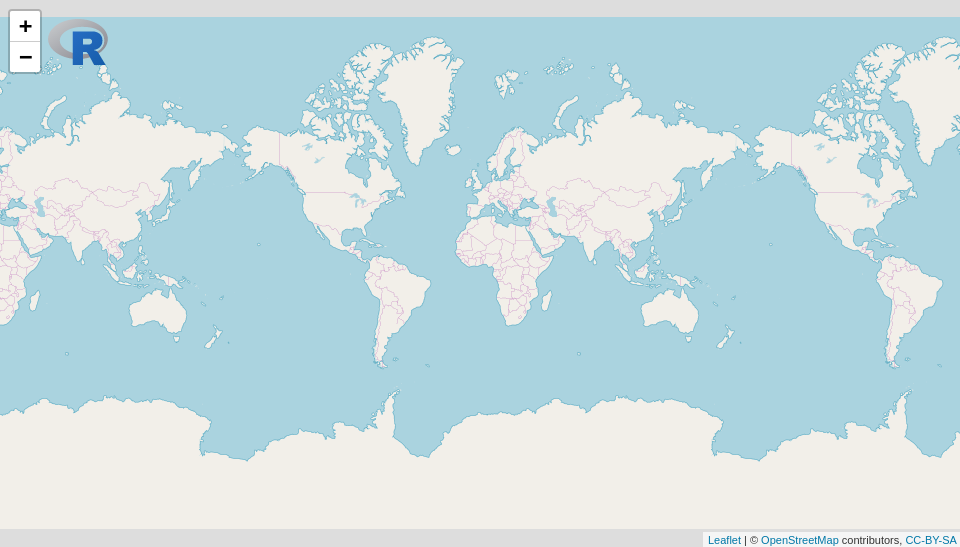
leaflet() %>% addTiles() %>% addLogo(img, url = "https://www.r-project.org/logo/")
Code of Conduct
Please note that the ‘leafem’ project is released with a Contributor Code of Conduct. By participating in this project you agree to abide by its terms.