Legends for Maps.
maplegend
![]()
![]()

Create legends for maps and other graphics. Thematic maps need to be accompanied by legible legends to be fully comprehensible. This package offers a wide range of legends useful for cartography, some of which may also be useful for other types of graphics.
Installation
You can install the released version of maplegend from CRAN with:
install.packages("maplegend")
Alternatively, you can install the development version of maplegend from GitHub (dev branch) with:
remotes::install_github("riatelab/maplegend", ref = "dev")
Example
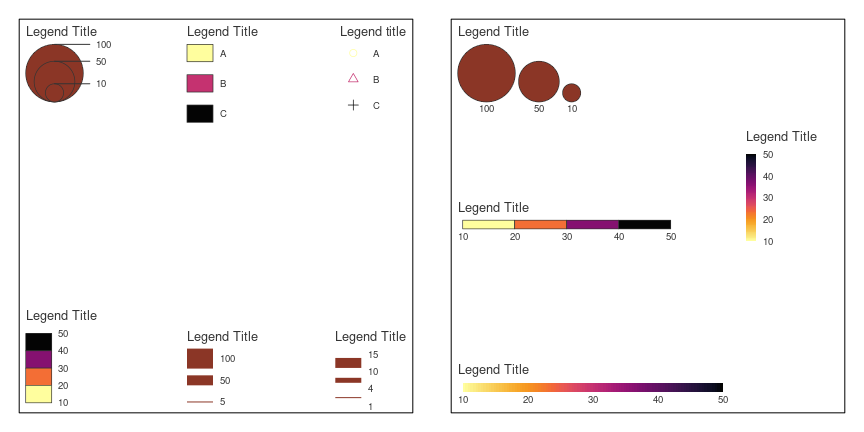
The main function is leg(). Its type argument defines the legend type.
library(maplegend)
opar <- par(mar = c(1, 1, 1, 1), mfrow = c(1, 2))
plot.new()
plot.window(xlim = c(0, 1), ylim = c(0, 1))
leg(type = "prop", val = c(10, 50, 100), pos = "topleft")
leg(type = "choro", val = c(10, 20, 30, 40, 50), pos = "bottomleft")
leg(type = "typo", val = c("A", "B", "C"), pos = "top")
leg(type = "symb", val = c("A", "B", "C"), pos = "topright")
set.seed(46)
leg(type = "histo", val = hist(rnorm(1000), breaks = 5, plot = FALSE))
leg(type = "prop_line", val = c(5, 50, 100), pos = "bottom", lwd = 20)
leg(type = "grad_line", val = c(1, 4, 10, 15), pos = "bottomright", lwd = c(1, 5, 10))
box()
plot.new()
plot.window(xlim = c(0, 100), ylim = c(-50, 50))
leg(type = "prop", val = c(10, 50, 100), pos = "topleft", horiz = TRUE)
leg(type = "cont", val = c(10, 20, 30, 40, 50), pos = "bottomleft", horiz = TRUE)
leg(type = "choro", val = c(10, 20, 30, 40, 50), pos = c(40, 10), horiz = TRUE)
leg(type = "cont", val = c(10, 20, 30, 40, 50), pos = "left")
leg(
  type = "symb", val = c("Points", "Lines", "Polygons"), pos = "topright",
  pch = list(21, "৲", 22), cex = c(2, 2, 2), border = c("black", NA, "black"),
  pal = c("red", "blue", "grey90")
)
box()
par(opar)
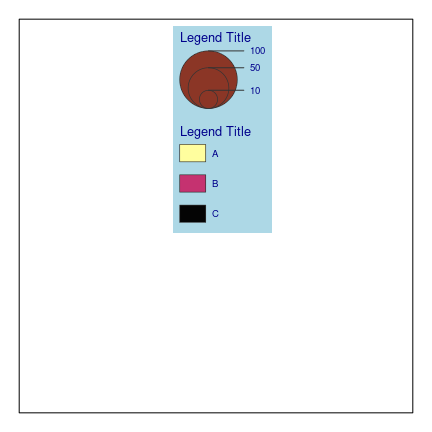
It is possible to create composed legends with leg_comp() and leg_draw().
opar <- par(mar = c(1, 1, 1, 1))
plot.new()
plot.window(xlim = c(0, 1), ylim = c(0, 1))
leg_comp(type = "prop", val = c(10, 50, 100)) |>
  leg_comp(type = "typo", val = c("A", "B", "C")) |>
  leg_draw(pos = "top", bg = "lightblue", fg = "darkblue", frame_border = NA)
box()
par(opar)
Background
This package is mainly intended for the construction of legends in the mapsf package. However, it can also be used independently of mapsf with base plots or even with igraph plots.
Community Guidelines
One can contribute to the package through pull requests and report issues or ask questions here.
This project uses conventional commits and semantic versioning.