Measles Epidemiological Models.
measles 
![]()
![]()
![]()
![]()
Overview
The measles package is a specialized spinoff from epiworldR, focusing exclusively on measles epidemiological models. This package provides fast, agent-based models (ABMs) for studying measles transmission dynamics, vaccination strategies, and intervention policies.
Built on the powerful epiworld C++ library, these models leverage the speed and flexibility of epiworldR while providing specialized functionality for measles outbreak modeling.
You can learn more about the ongoing efforts to model measles outbreaks in ForeSITE’s measles repository: https://github.com/EpiForeSITE/measles.
Features
- Fast simulation: Leverages the high-performance C++ backend from epiworld
- Specialized measles models: Three distinct models tailored for different scenarios
- Flexible interventions: Support for vaccination, quarantine, isolation, and contact tracing
- Population mixing: Models can account for different population groups with varying contact patterns
- Risk-based strategies: Advanced models support risk-stratified quarantine policies
Models Included
The package includes three measles-specific models:
ModelMeaslesSchool: A SEIHR (Susceptible-Exposed-Infectious-Hospitalized-Recovered) model designed for school settings with isolation and quarantine policies.
ModelMeaslesMixing: A measles model with population mixing between different groups, including vaccination, quarantine, isolation, and contact tracing mechanisms.
ModelMeaslesMixingRiskQuarantine: An advanced mixing model with risk-based quarantine strategies that assign different quarantine durations based on exposure risk levels (high, medium, low).
Installation
You can install the measles package from GitHub:
# install.packages("devtools")
devtools::install_github("UofUEpiBio/measles")
Or from R-universe (recommended for the latest development version):
install.packages(
  'measles',
  repos = c(
    'https://uofuepibio.r-universe.dev',
    'https://cloud.r-project.org'
  )
)
Quick Example
Here’s a simple example using the ModelMeaslesSchool:
library(measles)
#> Loading required package: epiworldR
#> Thank you for using epiworldR! Please consider citing it in your work.
#> You can find the citation information by running
#>   citation("epiworldR")

# Create a measles model for a school with 500 students
model_school <- ModelMeaslesSchool(
  n = 500,
  contact_rate = 10 / .9 / 4, # R0 of 10
  prevalence = 1,
  prop_vaccinated = 0.70,
  quarantine_period = -1,
  vax_efficacy = 0.97
)

# Run the simulation
run_multiple(
  model_school,
  ndays = 200,
  seed = 1912,
  nsims = 400,
  saver = make_saver("outbreak_size"),
  nthreads = 4L
)
#> Starting multiple runs (400) using 4 thread(s)
#> _________________________________________________________________________
#> _________________________________________________________________________
#> ||||||||||||||||||||||||||||||||||||||||||||||||||||||||||||||||||||||||| done.
We can take a quick look at the last run using the summary() function:
# View results
summary(model_school)
#> ________________________________________________________________________________
#> ________________________________________________________________________________
#> SIMULATION STUDY
#>
#> Name of the model   : (none)
#> Population size     : 500
#> Agents' data        : (none)
#> Number of entities  : 0
#> Days (duration)     : 200 (of 200)
#> Number of viruses   : 1
#> Last run elapsed t  : 1.00ms
#> Total elapsed t     : 115.00ms (400 runs)
#> Last run speed      : 77.94 million agents x day / second
#> Average run speed   : 347.30 million agents x day / second
#> Rewiring            : off
#> Last seed used      : 1264933217
#>
#> Global events:
#>  - Update model (runs daily)
#>
#> Virus(es):
#>  - Measles
#>
#> Tool(s):
#>  - MMR 0.970000
#>
#> Model parameters:
#>  - (IGNORED) Vax improved recovery : 0.0e+00
#>  - Contact rate                    : 2.7778
#>  - Days undetected                 : 2.0000
#>  - Hospitalization period          : 7.0000
#>  - Hospitalization rate            : 0.2000
#>  - Incubation period               : 12.0000
#>  - Isolation period                : 4.0000
#>  - Prodromal period                : 4.0000
#>  - Quarantine period               : -1.0000
#>  - Quarantine willingness          : 1.0000
#>  - Rash period                     : 3.0000
#>  - Transmission rate               : 0.9000
#>  - Vaccination rate                : 0.7000
#>  - Vax efficacy                    : 0.9700
#>
#> Distribution of the population at time 200:
#>   - ( 0) Susceptible             : 499 -> 346
#>   - ( 1) Exposed                 :   1 -> 0
#>   - ( 2) Prodromal               :   0 -> 0
#>   - ( 3) Rash                    :   0 -> 0
#>   - ( 4) Isolated                :   0 -> 0
#>   - ( 5) Isolated Recovered      :   0 -> 0
#>   - ( 6) Detected Hospitalized   :   0 -> 0
#>   - ( 7) Quarantined Exposed     :   0 -> 0
#>   - ( 8) Quarantined Susceptible :   0 -> 0
#>   - ( 9) Quarantined Prodromal   :   0 -> 0
#>   - (10) Quarantined Recovered   :   0 -> 0
#>   - (11) Hospitalized            :   0 -> 0
#>   - (12) Recovered               :   0 -> 154
#>
#> Transition Probabilities:
#>  - Susceptible              1.00  0.00     -     -     -     -     -     -     -     -     -     -     -
#>  - Exposed                     -  0.92  0.08     -     -     -     -     -     -     -     -     -     -
#>  - Prodromal                   -     -  0.77  0.23     -     -     -     -     -     -     -     -     -
#>  - Rash                        -     -     -  0.29  0.18  0.15  0.08     -     -     -     -  0.13  0.16
#>  - Isolated                    -     -     -  0.12  0.35  0.20  0.22     -     -     -     -  0.03  0.08
#>  - Isolated Recovered          -     -     -     -     -  0.56     -     -     -     -     -     -  0.44
#>  - Detected Hospitalized       -     -     -     -     -     -  0.87     -     -     -     -     -  0.13
#>  - Quarantined Exposed         -     -     -     -     -     -     -     -     -     -     -     -     -
#>  - Quarantined Susceptible     -     -     -     -     -     -     -     -     -     -     -     -     -
#>  - Quarantined Prodromal       -     -     -     -     -     -     -     -     -     -     -     -     -
#>  - Quarantined Recovered       -     -     -     -     -     -     -     -     -     -     -     -     -
#>  - Hospitalized                -     -     -     -     -     -     -     -     -     -     -  0.78  0.22
#>  - Recovered                   -     -     -     -     -     -     -     -     -     -     -     -  1.00
And we can extract the results (outbreak size in this case), using the function run_multiple_get_results():
ans <- run_multiple_get_results(model_school)[[1]]
ans <- subset(ans, date == max(date))$outbreak_size
table(ans) |>
  prop.table() |>
  knitr::kable(
    col.names = c("Outbreak Size", "Proportion of Simulations"),
    digits = 3,
    caption = "Distribution of outbreak sizes across 400 simulations"
  )
| Outbreak Size | Proportion of Simulations |
|---|---|
| 1 | 0.175 |
| 2 | 0.038 |
| 3 | 0.013 |
| 4 | 0.002 |
| 6 | 0.002 |
| 136 | 0.002 |
| 140 | 0.013 |
| 141 | 0.002 |
| 142 | 0.005 |
| 143 | 0.002 |
| 144 | 0.010 |
| 145 | 0.013 |
| 146 | 0.022 |
| 147 | 0.020 |
| 148 | 0.022 |
| 149 | 0.028 |
| 150 | 0.048 |
| 151 | 0.058 |
| 152 | 0.052 |
| 153 | 0.068 |
| 154 | 0.072 |
| 155 | 0.052 |
| 156 | 0.072 |
| 157 | 0.048 |
| 158 | 0.048 |
| 159 | 0.028 |
| 160 | 0.032 |
| 161 | 0.015 |
| 162 | 0.010 |
| 163 | 0.020 |
| 164 | 0.005 |
| 165 | 0.002 |
Distribution of outbreak sizes across 400 simulations
Example with Population Mixing
The mixing models allow you to simulate measles spread across different population groups:
# Define three populations
e1 <- entity("Population 1", 3000, as_proportion = FALSE)
e2 <- entity("Population 2", 3000, as_proportion = FALSE)
e3 <- entity("Population 3", 3000, as_proportion = FALSE)

# Define contact matrix (row-stochastic: rows sum to 1)
contact_matrix <- matrix(c(
  0.9, 0.05, 0.05,
  0.1, 0.8,  0.1,
  0.1, 0.2,  0.7
), byrow = TRUE, nrow = 3)

# Create the model
measles_model <- ModelMeaslesMixing(
  n = 9000,
  prevalence = 1 / 9000,
  contact_rate = 15,
  transmission_rate = 0.9,
  vax_efficacy = 0.97,
  prop_vaccinated = 0.95,
  contact_matrix = contact_matrix,
  quarantine_period = 14,
  isolation_period = 10
)

# Add entities and run
measles_model |>
  add_entity(e1) |>
  add_entity(e2) |>
  add_entity(e3)

run_multiple(
  measles_model, ndays = 100, seed = 331,
  nsims = 400,
  saver = make_saver("outbreak_size"),
  nthreads = 4L
)
#> Starting multiple runs (400) using 4 thread(s)
#> _________________________________________________________________________
#> _________________________________________________________________________
#> ||||||||||||||||||||||||||||||||||||||||||||||||||||||||||||||||||||||||| done.

summary(measles_model)
#> ________________________________________________________________________________
#> ________________________________________________________________________________
#> SIMULATION STUDY
#>
#> Name of the model   : Measles with Mixing and Quarantine
#> Population size     : 9000
#> Agents' data        : (none)
#> Number of entities  : 3
#> Days (duration)     : 100 (of 100)
#> Number of viruses   : 1
#> Last run elapsed t  : 0.00s
#> Total elapsed t     : 3.00s (400 runs)
#> Last run speed      : 19.84 million agents x day / second
#> Average run speed   : 91.46 million agents x day / second
#> Rewiring            : off
#> Last seed used      : 1428497254
#>
#> Global events:
#>  - Update infected individuals (runs daily)
#>
#> Virus(es):
#>  - Measles
#>
#> Tool(s):
#>  - MMR 0.970000
#>
#> Model parameters:
#>  - (IGNORED) Vax improved recovery : 0.5000
#>  - Contact rate                    : 15.0000
#>  - Contact tracing days prior      : 4.0000
#>  - Contact tracing success rate    : 1.0000
#>  - Days undetected                 : 2.0000
#>  - Hospitalization period          : 7.0000
#>  - Hospitalization rate            : 0.2000
#>  - Incubation period               : 12.0000
#>  - Isolation period                : 10.0000
#>  - Isolation willingness           : 1.0000
#>  - Prodromal period                : 4.0000
#>  - Quarantine period               : 14.0000
#>  - Quarantine willingness          : 1.0000
#>  - Rash period                     : 3.0000
#>  - Transmission rate               : 0.9000
#>  - Vaccination rate                : 0.9500
#>  - Vax efficacy                    : 0.9700
#>
#> Distribution of the population at time 100:
#>   - ( 0) Susceptible             : 8999 -> 8326
#>   - ( 1) Exposed                 :    1 -> 50
#>   - ( 2) Prodromal               :    0 -> 20
#>   - ( 3) Rash                    :    0 -> 6
#>   - ( 4) Isolated                :    0 -> 2
#>   - ( 5) Isolated Recovered      :    0 -> 25
#>   - ( 6) Detected Hospitalized   :    0 -> 16
#>   - ( 7) Quarantined Exposed     :    0 -> 6
#>   - ( 8) Quarantined Susceptible :    0 -> 2
#>   - ( 9) Quarantined Prodromal   :    0 -> 3
#>   - (10) Quarantined Recovered   :    0 -> 0
#>   - (11) Hospitalized            :    0 -> 12
#>   - (12) Recovered               :    0 -> 532
#>
#> Transition Probabilities:
#>  - Susceptible              1.00  0.00     -     -     -     -     -     -  0.00     -     -     -     -
#>  - Exposed                     -  0.89  0.08     -     -     -     -  0.02     -  0.00     -     -     -
#>  - Prodromal                   -     -  0.74  0.25  0.00     -     -     -     -  0.01     -     -     -
#>  - Rash                        -     -     -  0.22  0.22  0.15  0.08     -     -     -     -  0.12  0.19
#>  - Isolated                    -     -     -     -  0.47  0.36  0.18     -     -     -     -     -     -
#>  - Isolated Recovered          -     -     -     -     -  0.88     -     -     -     -     -     -  0.12
#>  - Detected Hospitalized       -     -     -     -     -     -  0.86     -     -     -     -     -  0.14
#>  - Quarantined Exposed         -  0.04  0.00     -     -     -     -  0.89     -  0.07     -     -     -
#>  - Quarantined Susceptible  0.07     -     -     -     -     -     -     -  0.93     -     -     -     -
#>  - Quarantined Prodromal       -     -  0.01     -  0.27     -     -     -     -  0.72     -     -     -
#>  - Quarantined Recovered       -     -     -     -     -     -     -     -     -     -     -     -     -
#>  - Hospitalized                -     -     -     -     -     -     -     -     -     -     -  0.86  0.14
#>  - Recovered                   -     -     -     -     -     -     -     -     -     -     -     -  1.00
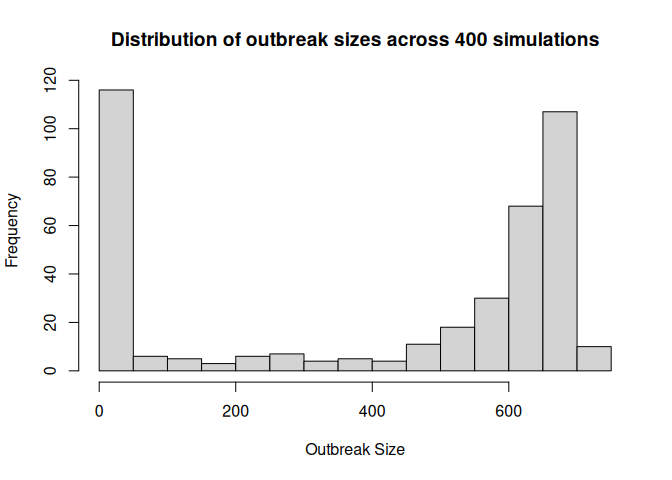
ans <- run_multiple_get_results(measles_model)[[1]]
ans <- subset(ans, date == max(date))$outbreak_size |>
  hist(
    main = "Distribution of outbreak sizes across 400 simulations",
    xlab = "Outbreak Size",
    ylab = "Frequency",
    breaks = 20
  )
Relationship to epiworldR
This package is a spinoff from epiworldR, which provides a comprehensive framework for agent-based epidemiological models. While epiworldR includes many different disease models (SIR, SEIR, SIS, etc.), the measles package focuses specifically on measles-related models with specialized features for:
- Measles-specific disease progression (incubation, prodromal, and rash periods)
- School-based outbreak scenarios
- Vaccination coverage and efficacy
- Quarantine and isolation policies
- Contact tracing strategies
- Risk-stratified interventions
For general-purpose epidemiological modeling or other disease types, please see the epiworldR package.
Citation
If you use the measles package in your research, please cite both this package and epiworldR:
citation("measles")
citation("epiworldR")
Contributing
Contributions are welcome! Please see the measles development guidelines for information on how to contribute.
Acknowledgments
This project was made possible by cooperative agreement CDC-RFA-FT-23-0069 from the CDC’s Center for Forecasting and Outbreak Analytics. Its contents are solely the responsibility of the authors and do not necessarily represent the official views of the Centers for Disease Control and Prevention.