Description
Online Time Series Anomaly Detectors.
Description
Implements a set of online fault detectors for time-series, called: PEWMA see M. Carter et al. (2012) <doi:10.1109/SSP.2012.6319708>, SD-EWMA and TSSD-EWMA see H. Raza et al. (2015) <doi:10.1016/j.patcog.2014.07.028>, KNN-CAD see E. Burnaev et al. (2016) <arXiv:1608.04585>, KNN-LDCD see V. Ishimtsev et al. (2017) <arXiv:1706.03412> and CAD-OSE see M. Smirnov (2018) <https://github.com/smirmik/CAD>. The first three algorithms belong to prediction-based techniques and the last three belong to window-based techniques. In addition, the SD-EWMA and PEWMA algorithms are algorithms designed to work in stationary environments, while the other four are algorithms designed to work in non-stationary environments.
README.md
otsad
Online Time Series Anomaly Detectors
This package provides anomaly detectors in the context of online time series and their evaluation with the Numenta score.
Installation
Dependencies
CAD-OSE algorithm is implemented in Python. It uses bencode library in the hashing step. This dependency can be installed with the Python package manager pip.
$ sudo pip install bencode-python3
otsad package
You can install the released version of otsad from CRAN with:
# Get the released version from CRAN
install.packages("otsad")

# Get the latest development version from GitHub
devtools::install_github("alaineiturria/otsad")
Most useful functions
Detectors
- PEWMA
- Offline:
CpPewma - Online:
IpPewma
- Offline:
- SD-EWMA
- Offline:
CpSdEwma - Online:
IpSdEwma
- Offline:
- TSSD-EWMA
- Offline:
CpTsSdEwma - Online:
IpTsSdEwma
- Offline:
- KNN-ICAD
- Offline:
CpKnnCad(ncm.type = "ICAD") - Online:
IpKnnCad(ncm.type = "ICAD")
- Offline:
- KNN-LDCD
- Offline
CpKnnCad(ncm.type = "LDCD") - Online:
IpKnnCad(ncm.type = "LDCD")
- Offline
- CAD-OSE
- Offline and Online:
ContextualAnomalyDetector
- Offline and Online:
NAB score
- Get score: GetDetectorScore
- Normalize score:
NormalizeScore+GetNullAndPerfectScores
False Positve Reduction
- Offline and Online:
ReduceAnomalies
Static or interactive visualizations
- Offline:
PlotDetections
NOTE:As usual in R, the documentation pages for each function can be loaded from the command line with the commands ? or help:
?CpSdEwma
help(CpSdEwma)
Example
This is a basic example of the use of otsad package:
library(otsad)

## basic example code

# Generate data
set.seed(100)
n <- 500
x <- sample(1:100, n, replace = TRUE)
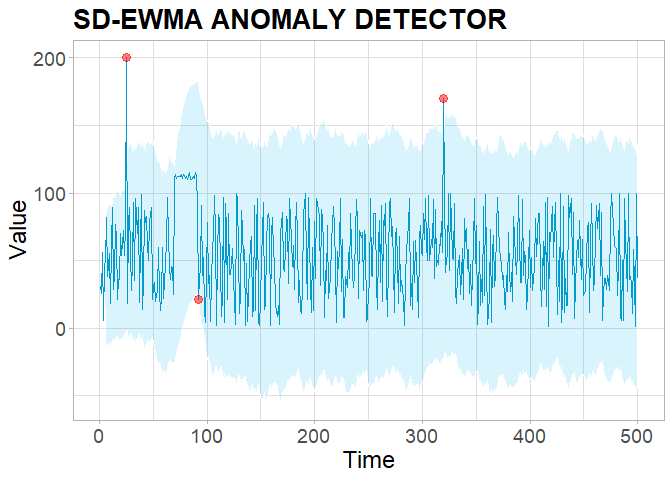
x[70:90] <- sample(110:115, 21, replace = TRUE) # distributional shift
x[25] <- 200 # abrupt transient anomaly
x[320] <- 170 # abrupt transient anomaly
df <- data.frame(timestamp = 1:n, value = x)

# Apply classic processing SD-EWMA detector
result <- CpSdEwma(data = df$value, n.train = 5, threshold = 0.01, l = 3)
res <- cbind(df, result)
PlotDetections(res, title = "SD-EWMA ANOMALY DETECTOR", return.ggplot = TRUE)

See plotly interactive graph
For more details, see otsad documentation and vignettes.