Description
Diagnostic and Plotting Functions to Supplement 'bartCause'.
Description
Functions to assist in diagnostics and plotting during the causal inference modeling process. Supplements the 'bartCause' package.
README.md
plotBart
plotBart is a diagnostic and plotting package for bartCause and thinkCausal.
library(plotBart)
data(lalonde)
confounders <- c('age', 'educ', 'black', 'hisp', 'married', 'nodegr')

# fit BART model
model_results <- bartCause::bartc(
  response = lalonde[['re78']],
  treatment = lalonde[['treat']],
  confounders = as.matrix(lalonde[, confounders]),
  estimand = 'ate',
  commonSup.rule = 'none',
  verbose = FALSE,
  keepTrees = TRUE
)

# plot common support
plot_common_support(.model = model_results)

# plot CATE and manipulate ggplot object
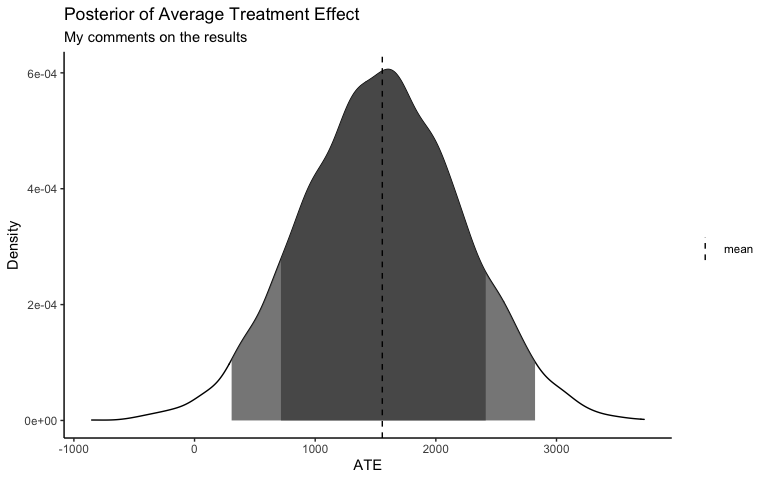
plot_CATE(
  .model = model_results,
  type = 'density',
  ci_80 = TRUE,
  ci_95 = TRUE,
  .mean = TRUE
) +
  labs(subtitle = 'My comments on the results') +
  theme_classic()

Installation
plotBart is currently in development and is available to test by installing via:
# install.packages("remotes")
remotes::install_github('priism-center/plotBart@*release')


