Description
Construct Process Maps Using Event Data.
Description
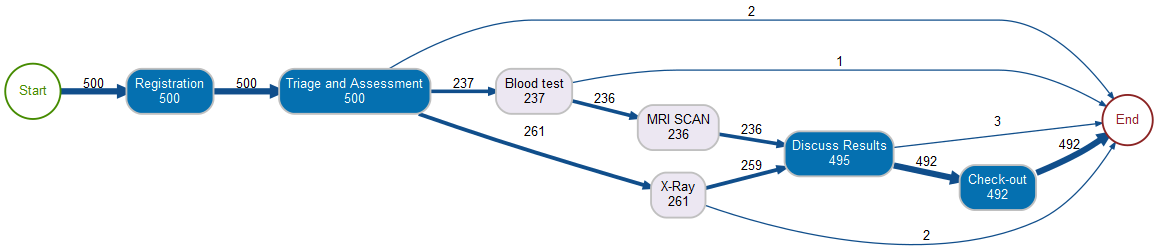
Visualize event logs using directed graphs, i.e. process maps. Part of the 'bupaR' framework.
README.md
processmapR 
![]()
![]()
![]()
processmapR is a R package for creating process maps. Part of the bupaR eco-system for business process analysis.
Installation
You can install processmapR from CRAN with:
install.packages("processmapR")
Development Version
You can install the development version of processmapR from GitHub with:
# install.packages("devtools")
devtools::install_github("bupaverse/processmapR")
Example
The bupaR Documentation website contains more details on creating process maps using processmapR.
library(processmapR)
#>
#> Attaching package: 'processmapR'
#> The following object is masked from 'package:stats':
#>
#>     frequency
library(bupaR)
#>
#> Attaching package: 'bupaR'
#> The following object is masked from 'package:stats':
#>
#>     filter
#> The following object is masked from 'package:utils':
#>
#>     timestamp

# Process map
patients %>%
  process_map()
# Dotted chart
patients %>%
  dotted_chart(x = "absolute", sort = "start")
