Description
Partitioning Using Local Subregions.
Description
A method of clustering functional data using subregion information of the curves. It is intended to supplement the 'fda' and 'fda.usc' packages in functional data object clustering. It also facilitates the printing and plotting of the results in a tree format and limits the partitioning candidates into a specific set of subregions.
README.md
puls
Partitioning using local subregions (PULS) is a clustering technique designed to explore subregions of functional data for information to split the curves into clusters.
Installation
You can install the released version of puls from CRAN with:
install.packages("puls")
And the development version from GitHub with:
# install.packages("remotes")
remotes::install_github("vinhtantran/puls")
Example
This is a basic example which shows you how to solve a common problem:
library(puls)
library(fda)
#> Loading required package: Matrix
#>
#> Attaching package: 'fda'
#> The following object is masked from 'package:graphics':
#>
#>     matplot
# Build a simple fd object from already smoothed smoothed_arctic
data(smoothed_arctic)
NBASIS <- 300
NORDER <- 4
y <- t(as.matrix(smoothed_arctic[, -1]))
splinebasis <- create.bspline.basis(rangeval = c(1, 365),
                                    nbasis = NBASIS,
                                    norder = NORDER)
fdParobj <- fdPar(fdobj = splinebasis,
                  Lfdobj = 2,
                  # No need for any more smoothing
                  lambda = .000001)
yfd <- smooth.basis(argvals = 1:365, y = y, fdParobj = fdParobj)

Jan <- c(1, 31); Feb <- c(31, 59); Mar <- c(59, 90)
Apr <- c(90, 120); May <- c(120, 151); Jun <- c(151, 181)
Jul <- c(181, 212); Aug <- c(212, 243); Sep <- c(243, 273)
Oct <- c(273, 304); Nov <- c(304, 334); Dec <- c(334, 365)

intervals <-
  rbind(Jan, Feb, Mar, Apr, May, Jun, Jul, Aug, Sep, Oct, Nov, Dec)

PULS4_pam <- PULS(toclust.fd = yfd$fd, intervals = intervals,
                  nclusters = 4, method = "pam")
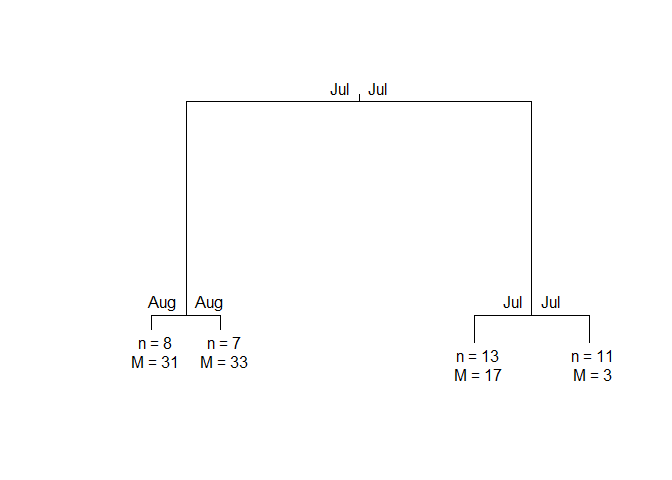
PULS4_pam
#> n = 39
#>
#> Node) Split, N, Cluster Inertia, Proportion Inertia Explained,
#>       * denotes terminal node
#>
#> 1) root 39 8453.2190 0.7072663
#>   2) Jul 15  885.3640 0.8431711
#>     4) Aug 8  311.7792   *
#>     5) Aug 7  178.8687   *
#>   3) Jul 24 1589.1780 0.7964770
#>     6) Jul 13  463.8466   *
#>     7) Jul 11  371.2143   *
#>
#> Note: One or more of the splits chosen had an alternative split that reduced inertia by the same amount. See "alt" column of "frame" object for details.
You can make a tree plot:
plot(PULS4_pam)

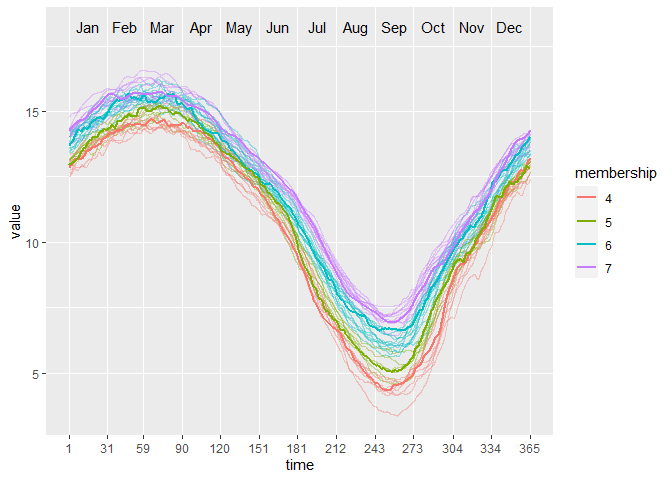
Or, a wave plot:
ggwave(toclust.fd = yfd$fd, intervals = intervals, puls = PULS4_pam)
