Description
Quantile G-Computation.
Description
G-computation for a set of time-fixed exposures with quantile-based basis functions, possibly under linearity and homogeneity assumptions. This approach estimates a regression line corresponding to the expected change in the outcome (on the link basis) given a simultaneous increase in the quantile-based category for all exposures. Works with continuous, binary, and right-censored time-to-event outcomes. Reference: Alexander P. Keil, Jessie P. Buckley, Katie M. OBrien, Kelly K. Ferguson, Shanshan Zhao, and Alexandra J. White (2019) A quantile-based g-computation approach to addressing the effects of exposure mixtures; <doi:10.1289/EHP5838>.
README.md
qgcomp v2.15.2
QGcomp (quantile g-computation): estimating the effects of exposure mixtures. Works for continuous, binary, and right-censored survival outcomes.
Flexible, unconstrained, fast and guided by modern causal inference principles
Quick start
# install developers version (requires devtools)
# install.packages("devtools")
# devtools::install_github("alexpkeil1/qgcomp")     # master version (usually reliable)
# devtools::install_github("alexpkeil1/qgcomp@dev") # dev version (may not be working)
# or install version from CRAN
install.packages("qgcomp")
library("qgcomp")
# using data from the qgcomp package
data("metals", package="qgcomp")

Xnm <- c(
'arsenic','barium','cadmium','calcium','chromium','copper',
'iron','lead','magnesium','manganese','mercury','selenium','silver',
'sodium','zinc'
)

# continuous outcome
results = qgcomp.noboot(y~.,dat=metals[,c(Xnm, 'y')], family=gaussian())
print(results)


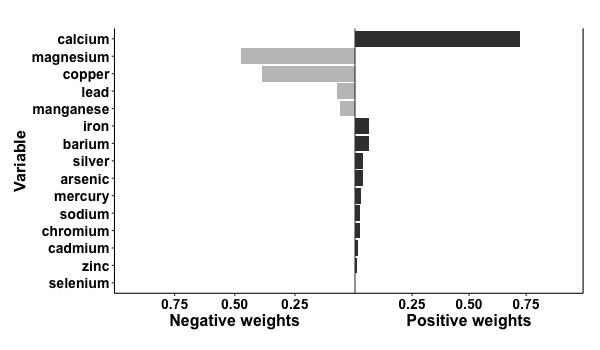
> Scaled effect size (positive direction, sum of positive coefficients = 0.39)
>  calcium     iron   barium   silver  arsenic  mercury   sodium chromium  cadmium     zinc
>  0.72216  0.06187  0.05947  0.03508  0.03447  0.02451  0.02162  0.02057  0.01328  0.00696
>
> Scaled effect size (negative direction, sum of negative coefficients = -0.124)
> magnesium    copper      lead manganese  selenium
>  0.475999  0.385299  0.074019  0.063828  0.000857
>
> Mixture slope parameters (Delta method CI):
>
>              Estimate Std. Error Lower CI Upper CI t value  Pr(>|t|)
> (Intercept) -0.356670   0.107878 -0.56811 -0.14523 -3.3062 0.0010238
> psi1         0.266394   0.071025  0.12719  0.40560  3.7507 0.0002001
p = plot(results, suppressprint=TRUE)
ggplot2::ggsave("res1.png", plot=p, dpi=72, width=600/72, height=350/72, units="in")
# binary outcome
results2 = qgcomp.noboot(disease_state~., expnms=Xnm,
           data = metals[,c(Xnm, 'disease_state')], family=binomial(), q=4)
print(results2)

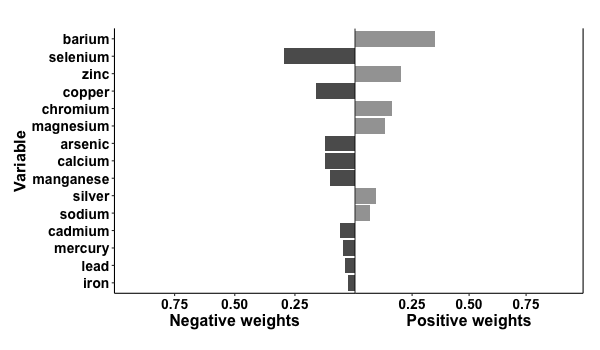
> Scaled effect size (positive direction, sum of positive coefficients = 0.392)
>    barium      zinc  chromium magnesium    silver    sodium
>    0.3520    0.2002    0.1603    0.1292    0.0937    0.0645
>
> Scaled effect size (negative direction, sum of negative coefficients = -0.696)
>  selenium    copper   arsenic   calcium manganese   cadmium   mercury      lead      iron
>    0.2969    0.1627    0.1272    0.1233    0.1033    0.0643    0.0485    0.0430    0.0309
>
> Mixture log(OR) (Delta method CI):
>
>             Estimate Std. Error Lower CI Upper CI Z value Pr(>|z|)
> (Intercept)  0.26362    0.51615 -0.74802  1.27526  0.5107   0.6095
> psi1        -0.30416    0.34018 -0.97090  0.36258 -0.8941   0.3713

p2 = plot(results2, suppressprint=TRUE)
ggplot2::ggsave("res2.png", plot=p2, dpi=72, width=600/72, height=350/72, units="in")
adjusting for covariate(s)
results3 = qgcomp.noboot(y ~ mage35 + arsenic + barium + cadmium + calcium + chloride +
                       chromium + copper + iron + lead + magnesium + manganese +
                       mercury + selenium + silver + sodium + zinc,
                     expnms=Xnm,
                     metals, family=gaussian(), q=4)
print(results3)

> Scaled effect size (positive direction, sum of positive coefficients = 0.381)
>  calcium   barium     iron   silver  arsenic  mercury chromium     zinc   sodium  cadmium
>  0.74466  0.06636  0.04839  0.03765  0.02823  0.02705  0.02344  0.01103  0.00775  0.00543
>
> Scaled effect size (negative direction, sum of negative coefficients = -0.124)
> magnesium    copper      lead manganese  selenium
>   0.49578   0.35446   0.08511   0.06094   0.00372
>
> Mixture slope parameters (Delta method CI):
>
>              Estimate Std. Error Lower CI Upper CI t value  Pr(>|t|)
> (Intercept) -0.348084   0.108037 -0.55983 -0.13634 -3.2219 0.0013688
> psi1         0.256969   0.071459  0.11691  0.39703  3.5960 0.0003601

# coefficient for confounder
results3$fit$coefficients['mage35']
>      mage35
>  0.03463519
Bootstrapping to get population average risk ratio via g-computation using qgcomp.boot
results4 = qgcomp.boot(disease_state~., expnms=Xnm,
      data = metals[,c(Xnm, 'disease_state')], family=binomial(),
      q=4, B=1000,# B should be 200-500+ in practice
      seed=125, rr=TRUE)
print(results4)

> Mixture log(RR) (bootstrap CI):
>
>             Estimate Std. Error Lower CI  Upper CI Z value Pr(>|z|)
> (Intercept) -0.56237    0.23773 -1.02832 -0.096421 -2.3655   0.0180
> psi1        -0.16373    0.17239 -0.50161  0.174158 -0.9497   0.3423

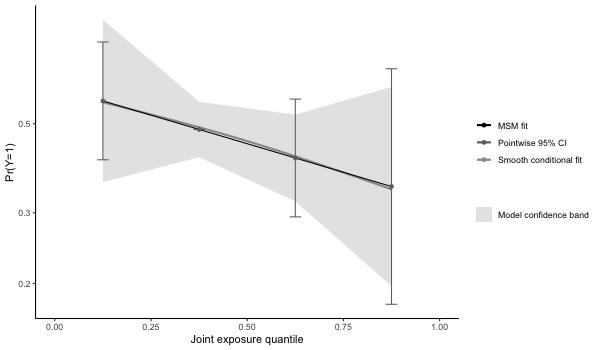
# checking whether model fit seems appropriate (note that the conditional fit
# appears slightly non-linear. The conditional model is on the log-odds scale
# wheras the marginal structural model is on the log-probability scale ).
# The plot is on the log-10 scale.
p4 = plot(results4, suppressprint=TRUE)
ggplot2::ggsave("res4.png", plot=p4, dpi=72, width=600/72, height=350/72, units="in")
Allowing for interactions and non-linear terms using qgcomp.boot
results5 = qgcomp(y~. + .^2 + arsenic*cadmium,
                     expnms=Xnm,
                     metals[,c(Xnm, 'y')], family=gaussian(), q=4, B=10,
                     seed=125, degree=2)

print(results5)

> Mixture slope parameters (bootstrap CI):
>
>             Estimate Std. Error Lower CI Upper CI t value Pr(>|t|)
> (Intercept) -0.89239    0.70336 -2.27095  0.48617 -1.2688   0.2055
> psi1         0.90649    0.93820 -0.93235  2.74533  0.9662   0.3347
> psi2        -0.19970    0.32507 -0.83682  0.43743 -0.6143   0.5395

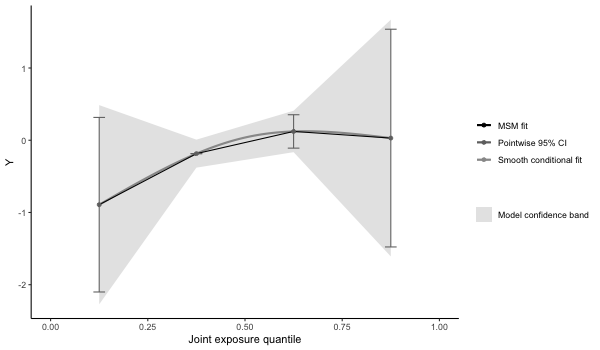
# some apparent non-linearity, but would require more bootstrap iterations for
# proper test of non-linear mixture effect
p5 = plot(results5, suppressprint=TRUE)
ggplot2::ggsave("res5.png", plot=p5, dpi=72, width=600/72, height=350/72, units="in")
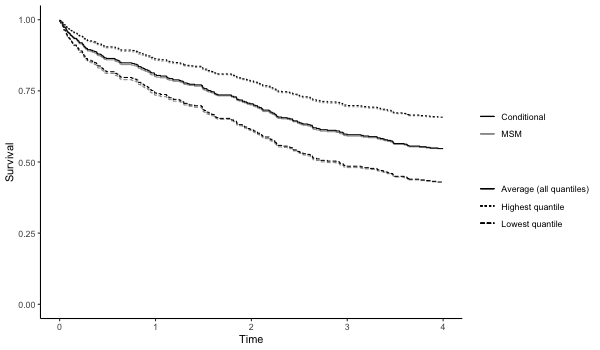
Survival outcomes with and without bootstrapping (fitting a marginal structural cox model to estimate the hazard ratio)
results6 = qgcomp.cox.noboot(Surv(disease_time, disease_state)~.,
                     expnms=Xnm,
                     metals[,c(Xnm, 'disease_time', 'disease_state')])

print(results6)

> Scaled effect size (positive direction, sum of positive coefficients = 0.32)
>    barium      zinc magnesium  chromium    silver    sodium      iron
>    0.3432    0.1946    0.1917    0.1119    0.0924    0.0511    0.0151
>
> Scaled effect size (negative direction, sum of negative coefficients = -0.554)
>  selenium    copper   calcium   arsenic manganese   cadmium      lead   mercury
>    0.2705    0.1826    0.1666    0.1085    0.0974    0.0794    0.0483    0.0466
>
> Mixture log(hazard ratio) (Delta method CI):
>
>      Estimate Std. Error Lower CI Upper CI Z value Pr(>|z|)
> psi1 -0.23356    0.24535 -0.71444  0.24732 -0.9519   0.3411

results7 = qgcomp.cox.boot(Surv(disease_time, disease_state)~.,
                     expnms=Xnm,
                     metals[,c(Xnm, 'disease_time', 'disease_state')],
                     B=10, MCsize=5000)

p7 = plot(results7, suppressprint=TRUE)
ggplot2::ggsave("res7.png", plot=p7, dpi=72, width=600/72, height=350/72, units="in")
More help
See the vignette which is included with the qgcomp R package, and is accessible in R via vignette("qgcomp-vignette", package="qgcomp")
