'WebGL'-Based 3D Plotting using the 'three.js' Library.
r3js
This is the project directory for the r3js, a package to provide R and javascript functions to allow WebGL-based 3D plotting in R using the three.js javascript library. Simple interactivity through roll-over highlighting and toggle buttons is also supported.
Plots are built as html widgets, using the RStudio viewer panel to display the plots interactively. Plots can also be exported using the functions provided in the htmlwidgets package.
Installation
You can install tthe latest CRAN release with:
install.packages("r3js")
Or install the latest development version from GitHub with:
# install.packages("devtools")
devtools::install_github("shwilks/r3js")
Introduction
Generally, r3js works by generating an object containing the plotting data and then continuously updating it as new features are added to the plot (similar to plotly). For a simple 3D scatterplot however, the plot3js function handles all of the plotting setup for you. Plotting syntax is intended to be similar to the base plotting functions in R, and that used in the RGL package.
Several ways to add interactivity to plots are currently supported, namely labels, highlighting on mouse roll-over, and toggle buttons.
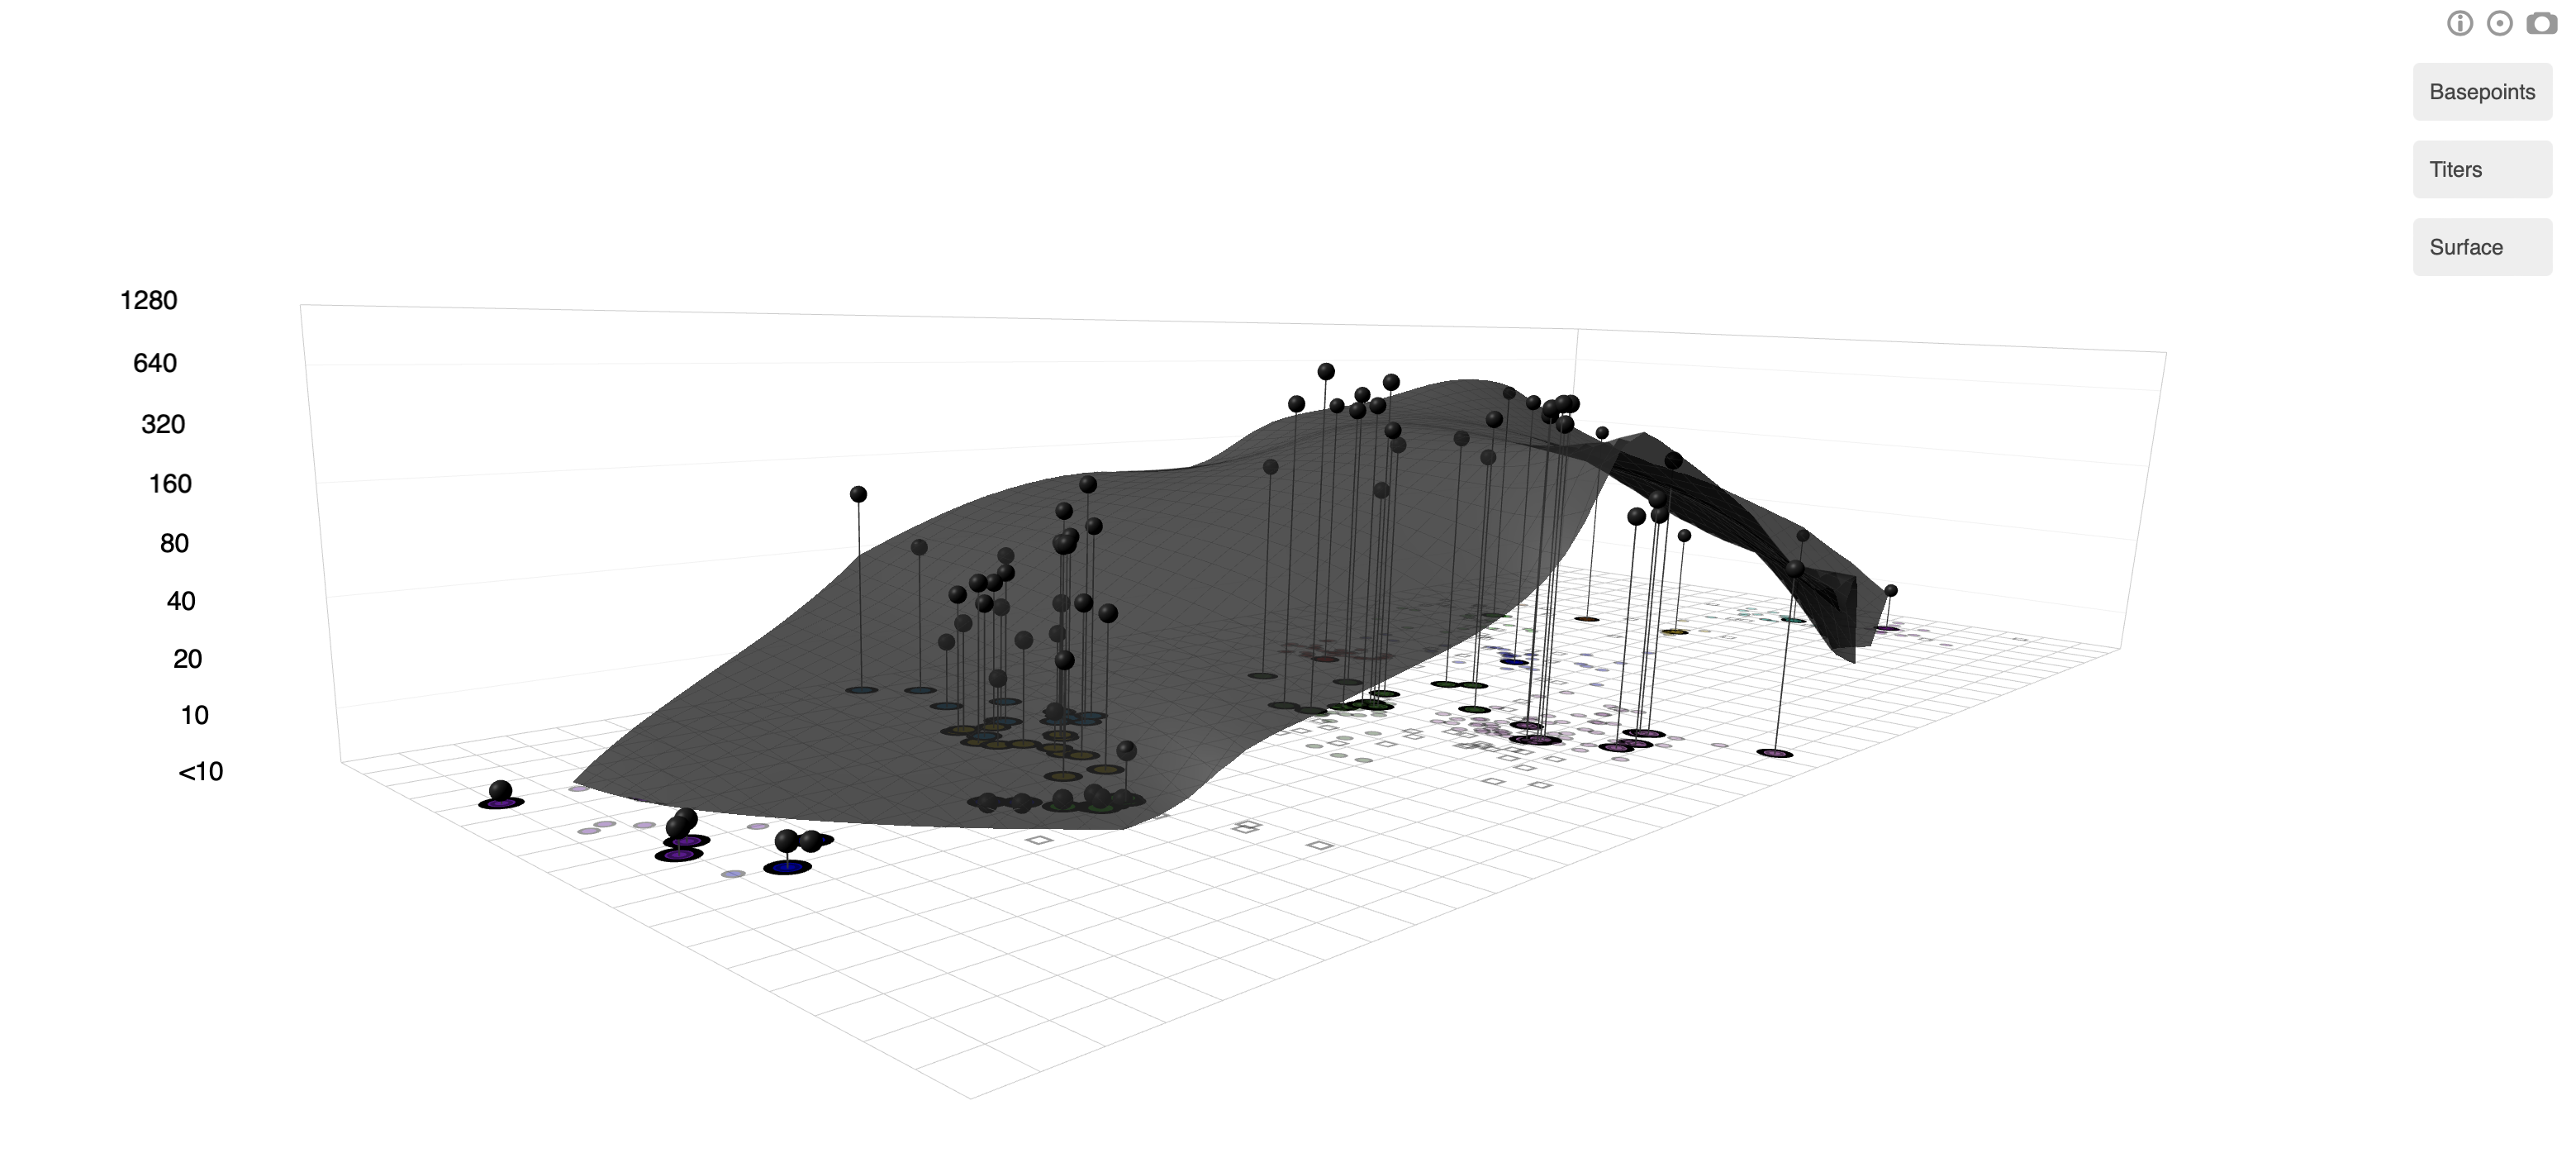
Using the possibilities together you can create plots like the one below.
Learn more
For a basic introduction to plotting and using the different types of interactivity see the article Getting started. For a more complex example using plot element groupings to link interaction with one plot element to changes in others see the article Grouping plot elements.
