Reactivity Visualizer for 'shiny'.
reactlog 

Shiny is an R package from RStudio that makes it incredibly easy to build interactive web applications with R. Behind the scenes, Shiny builds a reactive graph that can quickly become intertwined and difficult to debug. reactlog provides a visual insight into that black box of Shiny reactivity.
After logging the reactive interactions of a Shiny application, reactlog constructs a directed dependency graph of the Shiny's reactive state at any time point in the record. The reactlog dependency graph provides users with the ability to visually see if reactive elements are:
- Not utilized (never retrieved)
- Over utilized (called independently many times)
- Interacting with unexpected elements
- Invalidating all expected dependencies
- Freezing (and thawing), preventing triggering of future reactivity
Major Features
There are many subtle features hidden throughout reactlog. Here is a short list quickly describing what is possible within reactlog:
- Display the reactivity dependency graph of your Shiny applications
- Navigate throughout your reactive history to replay element interactions
- Highlight reactive family trees
- Filter on reactive family trees
- Search for reactive elements
For a more in-depth explanation of reactlog, please visit the reactlog vignette.
Installation
To install the stable version from CRAN, run the following from an R console:
install.packages("reactlog")
For the latest development version:
remotes::install_github("rstudio/reactlog")
Usage
library(shiny)
library(reactlog)

# tell shiny to log all reactivity
reactlog_enable()

# run a shiny app
app <- system.file("examples/01_hello", package = "shiny")
runApp(app)

# once app has closed, display reactlog from shiny
shiny::reactlogShow()
Or while your Shiny app is running, press the key combination Ctrl+F3 (Mac: Cmd+F3) to launch the reactlog application.
To mark a specific execution time point within your Shiny app, press the key combination Ctrl+Shift+F3 (Mac: Cmd+Shift+F3). This will highlight a specific point in time in your reactlog.
Example
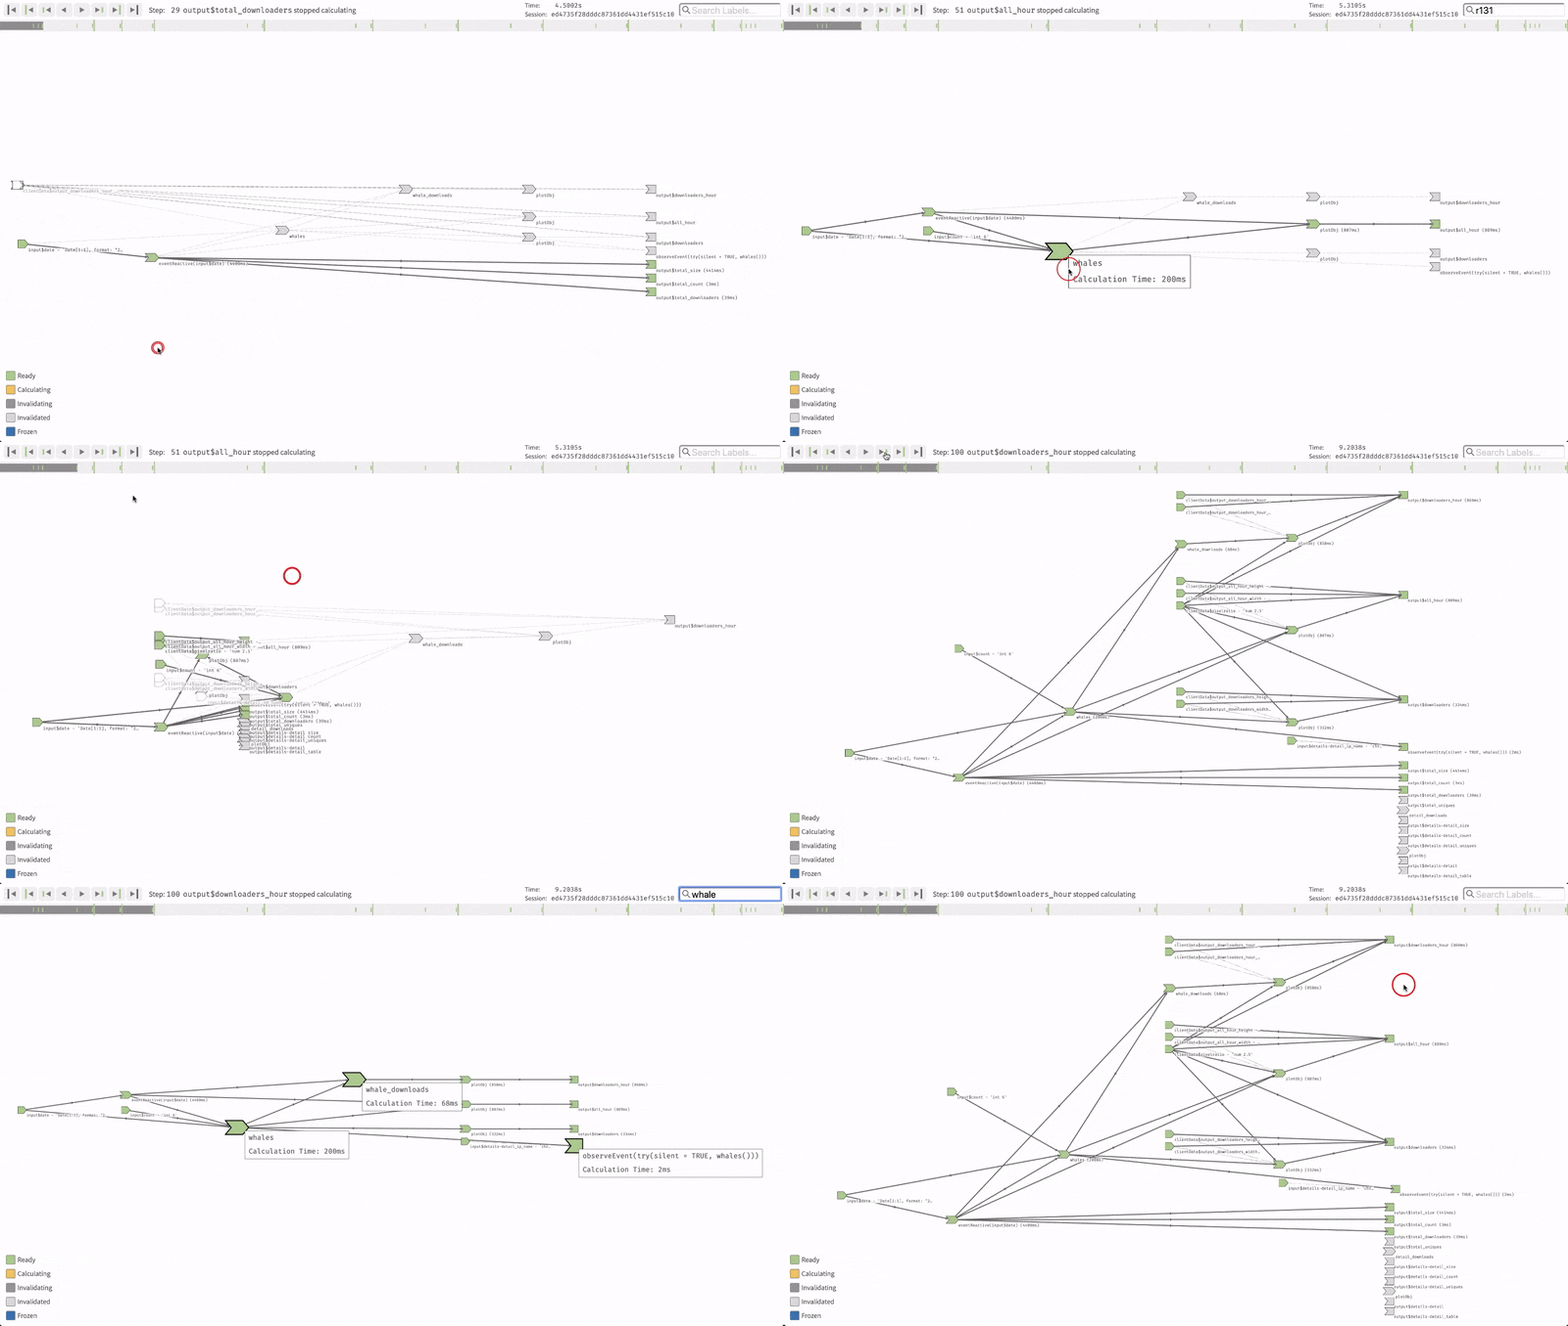
Here is a demo of the reactlog visualization applied to the cranwhales shiny app.
For more examples and explanation, see the reactlog vignette.
Community Support
The best place to get help with Shiny and reactlog is RStudio Community. If you're having difficulties with reactlog, feel free to ask questions here. For bug reports, please use the reactlogissue tracker.
Development
Please make sure you have GitHub Large File Storage, Node.js and yarn installed.
Installation script:
# install git lfs hooks
git lfs install

# install dependencies and build JavaScript
yarn install

# build on file change
yarn watch
By changing the file './inst/reactlog/defaultLog.js' with the contents of any log file in './inst/log-files/', different default log files can be loaded. Once the local JavaScript ('./inst/reactlog/reactlogAsset/reactlog.js') has been built with yarn build or yarn watch, refresh './inst/reactlog/reactlog.html' to avoid constantly spawning Shiny applications for testing.


