

Description
An Implementation of the 'SGL' Graphics Language.
Description
Generates plots from a database connection and a 'SGL' statement. 'SGL' is a graphics language designed to look and feel like 'SQL'. It is especially useful for those familiar with 'SQL' who want to specify plots in a similar manner. The 'SGL' language is described in Chapman (2025) <doi:10.48550/arXiv.2505.14690>.
README.md
rsgl

rsgl implements the SGL graphics language for use within R. SGL is a graphics language that is designed to look and feel like SQL, and is based on the grammar of graphics.
Installation
To install the official CRAN release:
install.packages("rsgl")
If you instead want the development version, install from GitHub with:
# install.packages("devtools")
devtools::install_github("sgl-projects/rsgl")
Usage
dbGetPlot is the primary interface to rsgl. It takes a DBI database connection and a SGL statement and returns the corresponding plot.
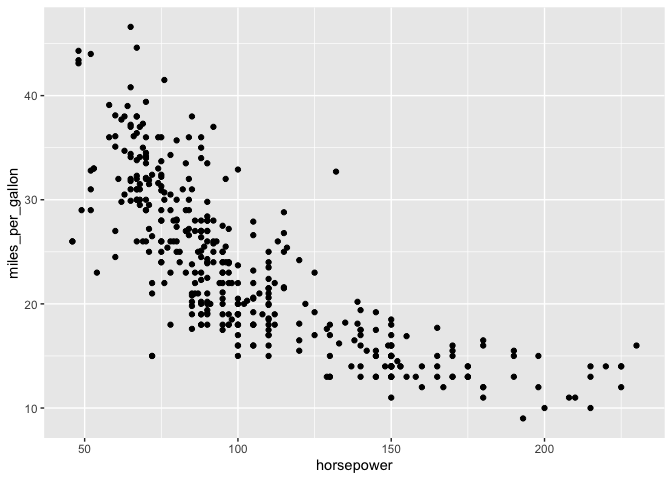
The following example demonstrates creating a DBI connection to an in-memory DuckDB database, loading it with data, and then generating a scatterplot from a SGL statement.
library(duckdb)
#> Loading required package: DBI
library(rsgl)
#>
#> Attaching package: 'rsgl'
#> The following objects are masked from 'package:datasets':
#>
#>     cars, trees

con <- dbConnect(duckdb())
dbWriteTable(con, "cars", cars)

dbGetPlot(con, "
    visualize
        horsepower as x,
        miles_per_gallon as y
    from cars
    using points
")
Next steps
- Get started — a tutorial of rsgl and the SGL language.
- Example gallery — a collection of plots generated with rsgl.