Statistical Models for the Unsupervised Segmentation of Time-Series ('SaMUraiS').
SaMUraiS: StAtistical Models for the UnsupeRvised segmentAtIon of time-Series
samurais is an open source toolbox (available in R and in Matlab) including many original and flexible user-friendly statistical latent variable models and unsupervised algorithms to segment and represent, time-series data (univariate or multivariate), and more generally, longitudinal data which include regime changes.
Our samurais use mainly the following efficient “sword” packages to segment data: Regression with Hidden Logistic Process (RHLP), Hidden Markov Model Regression (HMMR), Piece-Wise regression (PWR), Multivariate ‘RHLP’ (MRHLP), and Multivariate ‘HMMR’ (MHMMR).
The models and algorithms are developed and written in Matlab by Faicel Chamroukhi, and translated and designed into R packages by Florian Lecocq, Marius Bartcus and Faicel Chamroukhi.
Installation
You can install the samurais package from GitHub with:
# install.packages("devtools")
devtools::install_github("fchamroukhi/SaMUraiS")
To build vignettes for examples of usage, type the command below instead:
# install.packages("devtools")
devtools::install_github("fchamroukhi/SaMUraiS",
                         build_opts = c("--no-resave-data", "--no-manual"),
                         build_vignettes = TRUE)
Use the following command to display vignettes:
browseVignettes("samurais")
Usage
library(samurais)
RHLP
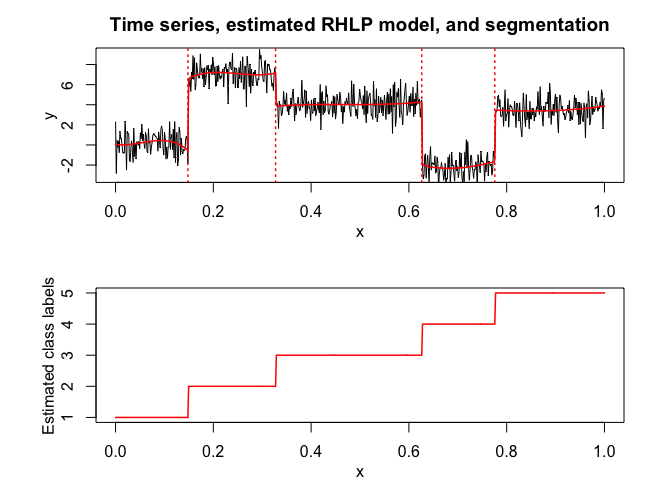
# Application to a toy data set
data("univtoydataset")

K <- 5 # Number of regimes (mixture components)
p <- 3 # Dimension of beta (order of the polynomial regressors)
q <- 1 # Dimension of w (order of the logistic regression: to be set to 1 for segmentation)
variance_type <- "heteroskedastic" # "heteroskedastic" or "homoskedastic" model

n_tries <- 1
max_iter = 1500
threshold <- 1e-6
verbose <- TRUE
verbose_IRLS <- FALSE

rhlp <- emRHLP(univtoydataset$x, univtoydataset$y, K, p, q,
               variance_type, n_tries, max_iter, threshold,
               verbose, verbose_IRLS)
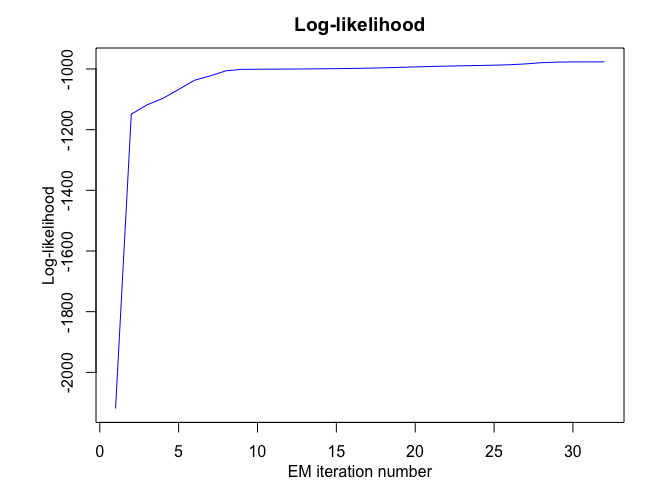
#> EM: Iteration : 1 || log-likelihood : -2119.27308534609
#> EM: Iteration : 2 || log-likelihood : -1149.01040321999
#> EM: Iteration : 3 || log-likelihood : -1118.20384281234
#> EM: Iteration : 4 || log-likelihood : -1096.88260636121
#> EM: Iteration : 5 || log-likelihood : -1067.55719357295
#> EM: Iteration : 6 || log-likelihood : -1037.26620122646
#> EM: Iteration : 7 || log-likelihood : -1022.71743069484
#> EM: Iteration : 8 || log-likelihood : -1006.11825447077
#> EM: Iteration : 9 || log-likelihood : -1001.18491883952
#> EM: Iteration : 10 || log-likelihood : -1000.91250763556
#> EM: Iteration : 11 || log-likelihood : -1000.62280600209
#> EM: Iteration : 12 || log-likelihood : -1000.3030988811
#> EM: Iteration : 13 || log-likelihood : -999.932334880131
#> EM: Iteration : 14 || log-likelihood : -999.484219706691
#> EM: Iteration : 15 || log-likelihood : -998.928118038989
#> EM: Iteration : 16 || log-likelihood : -998.234244664472
#> EM: Iteration : 17 || log-likelihood : -997.359536276056
#> EM: Iteration : 18 || log-likelihood : -996.152654857298
#> EM: Iteration : 19 || log-likelihood : -994.697863447307
#> EM: Iteration : 20 || log-likelihood : -993.186583974542
#> EM: Iteration : 21 || log-likelihood : -991.81352379631
#> EM: Iteration : 22 || log-likelihood : -990.611295217008
#> EM: Iteration : 23 || log-likelihood : -989.539226273251
#> EM: Iteration : 24 || log-likelihood : -988.55311887915
#> EM: Iteration : 25 || log-likelihood : -987.539963690533
#> EM: Iteration : 26 || log-likelihood : -986.073920116541
#> EM: Iteration : 27 || log-likelihood : -983.263549878169
#> EM: Iteration : 28 || log-likelihood : -979.340492188909
#> EM: Iteration : 29 || log-likelihood : -977.468559852711
#> EM: Iteration : 30 || log-likelihood : -976.653534236095
#> EM: Iteration : 31 || log-likelihood : -976.5893387433
#> EM: Iteration : 32 || log-likelihood : -976.589338067237

rhlp$summary()
#> ---------------------
#> Fitted RHLP model
#> ---------------------
#>
#> RHLP model with K = 5 components:
#>
#>  log-likelihood nu       AIC       BIC       ICL
#>       -976.5893 33 -1009.589 -1083.959 -1083.176
#>
#> Clustering table (Number of observations in each regimes):
#>
#>   1   2   3   4   5
#> 100 120 200 100 150
#>
#> Regression coefficients:
#>
#>       Beta(K = 1) Beta(K = 2) Beta(K = 3) Beta(K = 4) Beta(K = 5)
#> 1    6.031875e-02   -5.434903   -2.770416    120.7699    4.027542
#> X^1 -7.424718e+00  158.705091   43.879453   -474.5888   13.194261
#> X^2  2.931652e+02 -650.592347  -94.194780    597.7948  -33.760603
#> X^3 -1.823560e+03  865.329795   67.197059   -244.2386   20.402153
#>
#> Variances:
#>
#>  Sigma2(K = 1) Sigma2(K = 2) Sigma2(K = 3) Sigma2(K = 4) Sigma2(K = 5)
#>       1.220624      1.110243      1.079394     0.9779734      1.028332

rhlp$plot()

# Application to a real data set
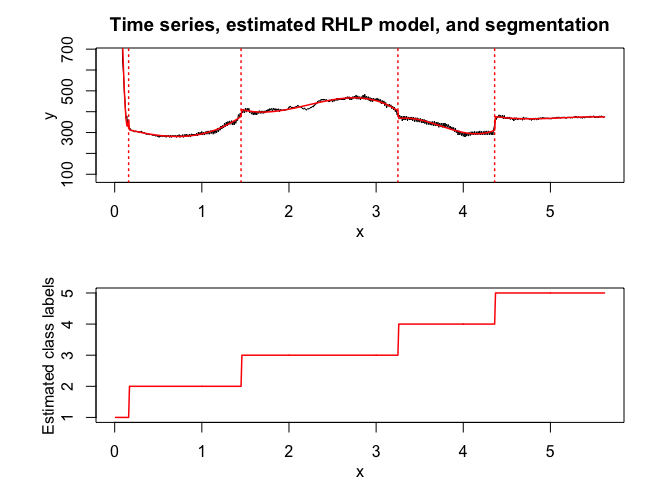
data("univrealdataset")

K <- 5 # Number of regimes (mixture components)
p <- 3 # Dimension of beta (order of the polynomial regressors)
q <- 1 # Dimension of w (order of the logistic regression: to be set to 1 for segmentation)
variance_type <- "heteroskedastic" # "heteroskedastic" or "homoskedastic" model

n_tries <- 1
max_iter = 1500
threshold <- 1e-6
verbose <- FALSE
verbose_IRLS <- FALSE

rhlp <- emRHLP(univrealdataset$x, univrealdataset$y2, K, p, q,
               variance_type, n_tries, max_iter, threshold,
               verbose, verbose_IRLS)

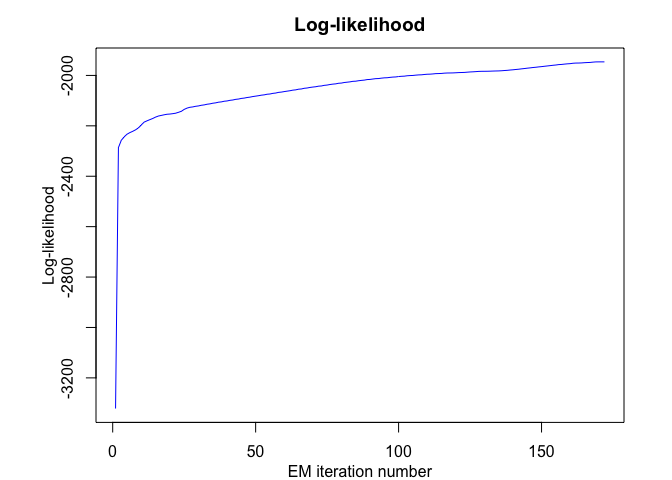
rhlp$summary()
#> ---------------------
#> Fitted RHLP model
#> ---------------------
#>
#> RHLP model with K = 5 components:
#>
#>  log-likelihood nu       AIC       BIC       ICL
#>       -1946.213 33 -1979.213 -2050.683 -2050.449
#>
#> Clustering table (Number of observations in each regimes):
#>
#>   1   2   3   4   5
#>  16 129 180 111 126
#>
#> Regression coefficients:
#>
#>     Beta(K = 1) Beta(K = 2) Beta(K = 3) Beta(K = 4) Beta(K = 5)
#> 1      2187.539   330.05723   1508.2809 -13446.7332  6417.62830
#> X^1  -15032.659  -107.79782  -1648.9562  11321.4509 -3571.94090
#> X^2  -56433.432    14.40154    786.5723  -3062.2825   699.55894
#> X^3  494014.670    56.88016   -118.0693    272.7844   -45.42922
#>
#> Variances:
#>
#>  Sigma2(K = 1) Sigma2(K = 2) Sigma2(K = 3) Sigma2(K = 4) Sigma2(K = 5)
#>       8924.363      49.22616       78.2758      105.6606      15.66317

rhlp$plot()

HMMR
# Application to a toy data set
data("univtoydataset")

K <- 5 # Number of regimes (states)
p <- 3 # Dimension of beta (order of the polynomial regressors)
variance_type <- "heteroskedastic" # "heteroskedastic" or "homoskedastic" model

n_tries <- 1
max_iter <- 1500
threshold <- 1e-6
verbose <- TRUE

hmmr <- emHMMR(univtoydataset$x, univtoydataset$y, K, p, variance_type,
               n_tries, max_iter, threshold, verbose)
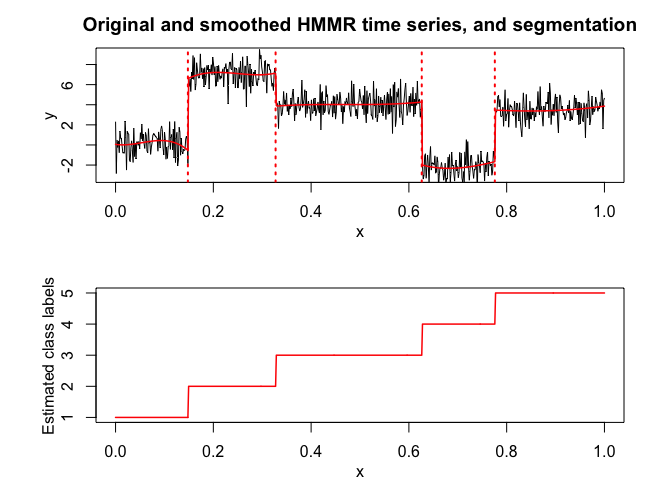
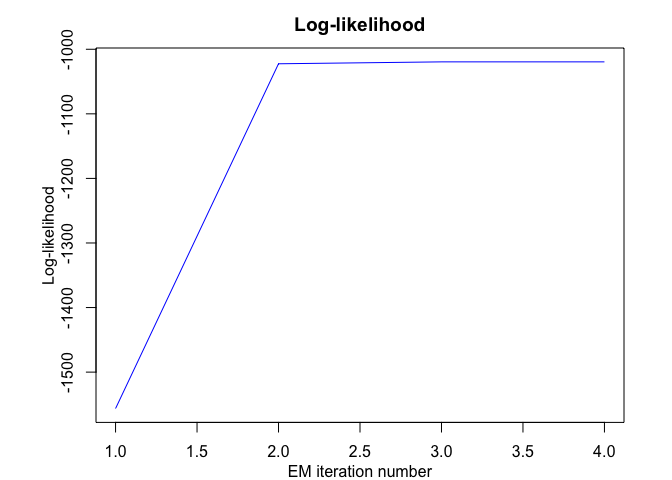
#> EM: Iteration : 1 || log-likelihood : -1556.39696825601
#> EM: Iteration : 2 || log-likelihood : -1022.47935723687
#> EM: Iteration : 3 || log-likelihood : -1019.51830707432
#> EM: Iteration : 4 || log-likelihood : -1019.51780361388

hmmr$summary()
#> ---------------------
#> Fitted HMMR model
#> ---------------------
#>
#> HMMR model with K = 5 components:
#>
#>  log-likelihood nu       AIC       BIC
#>       -1019.518 49 -1068.518 -1178.946
#>
#> Clustering table (Number of observations in each regimes):
#>
#>   1   2   3   4   5
#> 100 120 200 100 150
#>
#> Regression coefficients:
#>
#>       Beta(K = 1) Beta(K = 2) Beta(K = 3) Beta(K = 4) Beta(K = 5)
#> 1    6.031872e-02   -5.326689    -2.65064    120.8612    3.858683
#> X^1 -7.424715e+00  157.189455    43.13601   -474.9870   13.757279
#> X^2  2.931651e+02 -643.706204   -92.68115    598.3726  -34.384734
#> X^3 -1.823559e+03  855.171715    66.18499   -244.5175   20.632196
#>
#> Variances:
#>
#>  Sigma2(K = 1) Sigma2(K = 2) Sigma2(K = 3) Sigma2(K = 4) Sigma2(K = 5)
#>       1.220624      1.111487      1.080043     0.9779724      1.028399

hmmr$plot(what = c("smoothed", "regressors", "loglikelihood"))

# Application to a real data set
data("univrealdataset")

K <- 5 # Number of regimes (states)
p <- 3 # Dimension of beta (order of the polynomial regressors)
variance_type <- "heteroskedastic" # "heteroskedastic" or "homoskedastic" model

n_tries <- 1
max_iter <- 1500
threshold <- 1e-6
verbose <- TRUE

hmmr <- emHMMR(univrealdataset$x, univrealdataset$y2, K, p, variance_type,
               n_tries, max_iter, threshold, verbose)
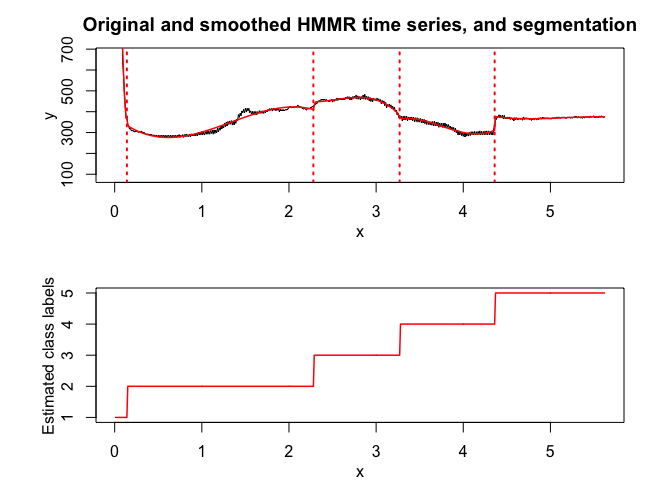
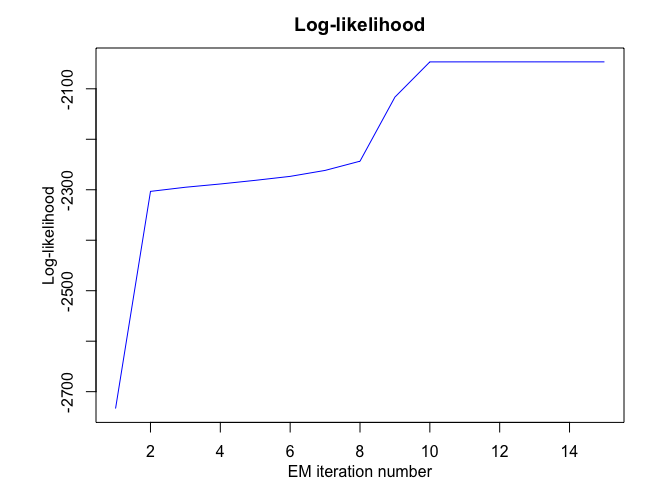
#> EM: Iteration : 1 || log-likelihood : -2733.41028643114
#> EM: Iteration : 2 || log-likelihood : -2303.24018378559
#> EM: Iteration : 3 || log-likelihood : -2295.0470677529
#> EM: Iteration : 4 || log-likelihood : -2288.57866215726
#> EM: Iteration : 5 || log-likelihood : -2281.36756202518
#> EM: Iteration : 6 || log-likelihood : -2273.50303676091
#> EM: Iteration : 7 || log-likelihood : -2261.70334656117
#> EM: Iteration : 8 || log-likelihood : -2243.43509121433
#> EM: Iteration : 9 || log-likelihood : -2116.4610801575
#> EM: Iteration : 10 || log-likelihood : -2046.73194777839
#> EM: Iteration : 11 || log-likelihood : -2046.68328282973
#> EM: Iteration : 12 || log-likelihood : -2046.67329222076
#> EM: Iteration : 13 || log-likelihood : -2046.66915144265
#> EM: Iteration : 14 || log-likelihood : -2046.66694236131
#> EM: Iteration : 15 || log-likelihood : -2046.66563379017

hmmr$summary()
#> ---------------------
#> Fitted HMMR model
#> ---------------------
#>
#> HMMR model with K = 5 components:
#>
#>  log-likelihood nu       AIC       BIC
#>       -2046.666 49 -2095.666 -2201.787
#>
#> Clustering table (Number of observations in each regimes):
#>
#>   1   2   3   4   5
#>  14 214  99 109 126
#>
#> Regression coefficients:
#>
#>     Beta(K = 1) Beta(K = 2) Beta(K = 3) Beta(K = 4) Beta(K = 5)
#> 1       2152.64   379.75158   5211.1759 -14306.4654  6417.62823
#> X^1   -12358.67  -373.37266  -5744.7879  11987.6666 -3571.94086
#> X^2  -103908.33   394.49359   2288.9418  -3233.8021   699.55894
#> X^3   722173.26   -98.60485   -300.7686    287.4567   -45.42922
#>
#> Variances:
#>
#>  Sigma2(K = 1) Sigma2(K = 2) Sigma2(K = 3) Sigma2(K = 4) Sigma2(K = 5)
#>       9828.793      125.3346      58.71053      105.8328      15.66317

hmmr$plot(what = c("smoothed", "regressors", "loglikelihood"))

PWR
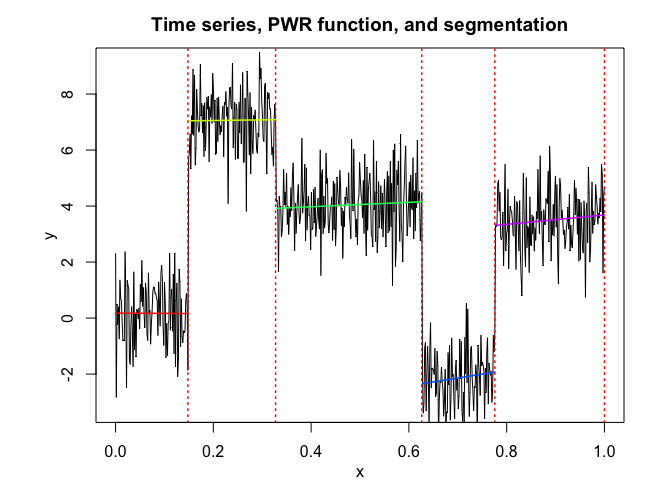
# Application to a toy data set
data("univtoydataset")

K <- 5 # Number of segments
p <- 1 # Polynomial degree

pwr <- fitPWRFisher(univtoydataset$x, univtoydataset$y, K, p)

pwr$plot()

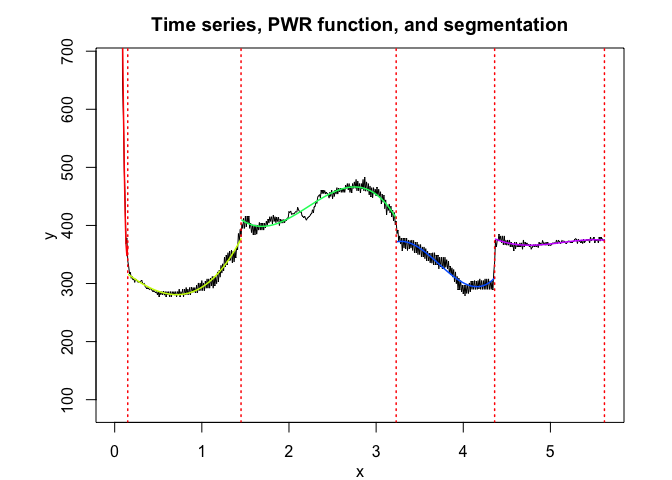
# Application to a real data set
data("univrealdataset")

K <- 5 # Number of segments
p <- 3 # Polynomial degree

pwr <- fitPWRFisher(univrealdataset$x, univrealdataset$y2, K, p)

pwr$plot()

MRHLP
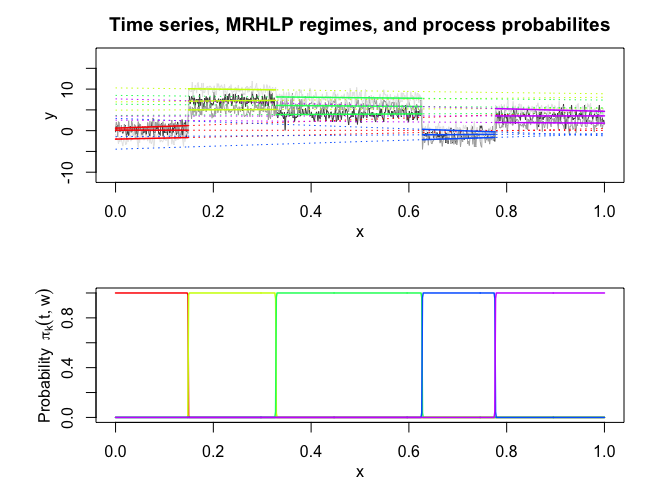
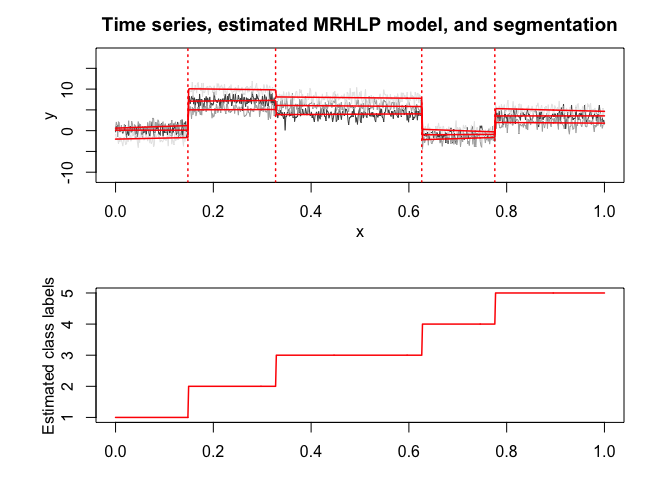
# Application to a toy data set
data("multivtoydataset")

K <- 5 # Number of regimes (mixture components)
p <- 1 # Dimension of beta (order of the polynomial regressors)
q <- 1 # Dimension of w (order of the logistic regression: to be set to 1 for segmentation)
variance_type <- "heteroskedastic" # "heteroskedastic" or "homoskedastic" model

n_tries <- 1
max_iter <- 1500
threshold <- 1e-6
verbose <- TRUE
verbose_IRLS <- FALSE

mrhlp <- emMRHLP(multivtoydataset$x, multivtoydataset[,c("y1", "y2", "y3")],
                 K, p, q, variance_type, n_tries, max_iter, threshold, verbose,
                 verbose_IRLS)
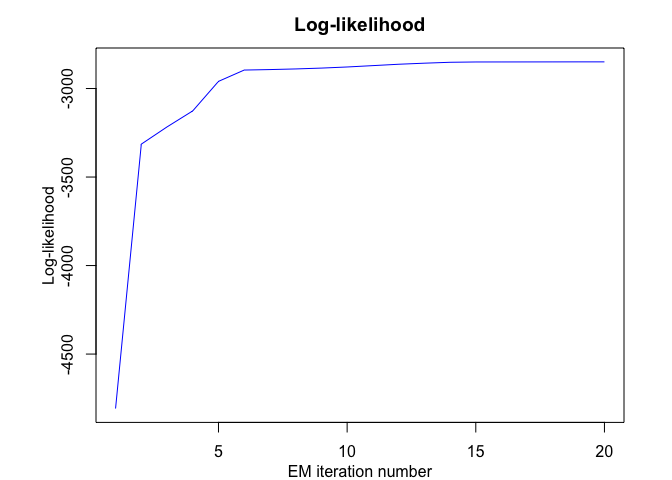
#> EM: Iteration : 1 || log-likelihood : -4807.6644322901
#> EM: Iteration : 2 || log-likelihood : -3314.25165556383
#> EM: Iteration : 3 || log-likelihood : -3216.8871750704
#> EM: Iteration : 4 || log-likelihood : -3126.33556053822
#> EM: Iteration : 5 || log-likelihood : -2959.59933830667
#> EM: Iteration : 6 || log-likelihood : -2895.65953485704
#> EM: Iteration : 7 || log-likelihood : -2892.93263500326
#> EM: Iteration : 8 || log-likelihood : -2889.34084959654
#> EM: Iteration : 9 || log-likelihood : -2884.56422084139
#> EM: Iteration : 10 || log-likelihood : -2878.29772085061
#> EM: Iteration : 11 || log-likelihood : -2870.61242183846
#> EM: Iteration : 12 || log-likelihood : -2862.86238149363
#> EM: Iteration : 13 || log-likelihood : -2856.85351443338
#> EM: Iteration : 14 || log-likelihood : -2851.74642203885
#> EM: Iteration : 15 || log-likelihood : -2850.00381259526
#> EM: Iteration : 16 || log-likelihood : -2849.86516522686
#> EM: Iteration : 17 || log-likelihood : -2849.7354103643
#> EM: Iteration : 18 || log-likelihood : -2849.56953544124
#> EM: Iteration : 19 || log-likelihood : -2849.40322468732
#> EM: Iteration : 20 || log-likelihood : -2849.40321381274

mrhlp$summary()
#> ----------------------
#> Fitted MRHLP model
#> ----------------------
#>
#> MRHLP model with K = 5 regimes
#>
#>  log-likelihood nu       AIC       BIC       ICL
#>       -2849.403 68 -2917.403 -3070.651 -3069.896
#>
#> Clustering table:
#>   1   2   3   4   5
#> 100 120 200 100 150
#>
#>
#> ------------------
#> Regime 1 (K = 1):
#>
#> Regression coefficients:
#>
#>     Beta(d = 1) Beta(d = 2) Beta(d = 3)
#> 1    0.11943184   0.6087582   -2.038486
#> X^1 -0.08556857   4.1038126    2.540536
#>
#> Covariance matrix:
#>
#>  1.19063336  0.12765794  0.05537134
#>  0.12765794  0.87144062 -0.05213162
#>  0.05537134 -0.05213162  0.87885166
#> ------------------
#> Regime 2 (K = 2):
#>
#> Regression coefficients:
#>
#>     Beta(d = 1) Beta(d = 2) Beta(d = 3)
#> 1      6.924025   4.9368460   10.288339
#> X^1    1.118034   0.4726707   -1.409218
#>
#> Covariance matrix:
#>
#>   1.0690431 -0.18293369 0.12602459
#>  -0.1829337  1.05280632 0.01390041
#>   0.1260246  0.01390041 0.75995058
#> ------------------
#> Regime 3 (K = 3):
#>
#> Regression coefficients:
#>
#>     Beta(d = 1) Beta(d = 2) Beta(d = 3)
#> 1     3.6535241   6.3654379    8.488318
#> X^1   0.6233579  -0.8866887   -1.126692
#>
#> Covariance matrix:
#>
#>   1.02591553 -0.05445227 -0.02019896
#>  -0.05445227  1.18941700  0.01565240
#>  -0.02019896  0.01565240  1.00257195
#> ------------------
#> Regime 4 (K = 4):
#>
#> Regression coefficients:
#>
#>     Beta(d = 1) Beta(d = 2) Beta(d = 3)
#> 1     -1.439637   -4.463014    2.952470
#> X^1    0.703211    3.649717   -4.187703
#>
#> Covariance matrix:
#>
#>   0.88000190 -0.03249118 -0.03411075
#>  -0.03249118  1.12087583 -0.07881351
#>  -0.03411075 -0.07881351  0.86060127
#> ------------------
#> Regime 5 (K = 5):
#>
#> Regression coefficients:
#>
#>     Beta(d = 1) Beta(d = 2) Beta(d = 3)
#> 1     3.4982408   2.5357751    7.652113
#> X^1   0.0574791  -0.7286824   -3.005802
#>
#> Covariance matrix:
#>
#>  1.13330209 0.25869951 0.03163467
#>  0.25869951 1.21230741 0.04746018
#>  0.03163467 0.04746018 0.80241715

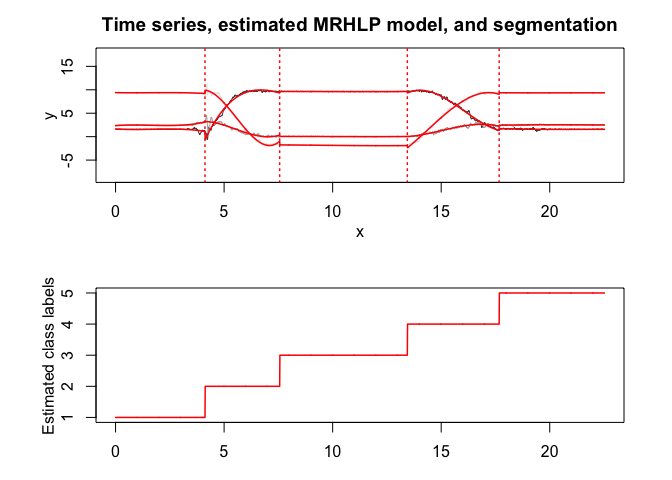
mrhlp$plot()
# Application to a real data set (human activity recogntion data)
data("multivrealdataset")

K <- 5 # Number of regimes (mixture components)
p <- 3 # Dimension of beta (order of the polynomial regressors)
q <- 1 # Dimension of w (order of the logistic regression: to be set to 1 for segmentation)
variance_type <- "heteroskedastic" # "heteroskedastic" or "homoskedastic" model

n_tries <- 1
max_iter <- 1500
threshold <- 1e-6
verbose <- TRUE
verbose_IRLS <- FALSE

mrhlp <- emMRHLP(multivrealdataset$x, multivrealdataset[,c("y1", "y2", "y3")],
                 K, p, q, variance_type, n_tries, max_iter, threshold, verbose,
                 verbose_IRLS)
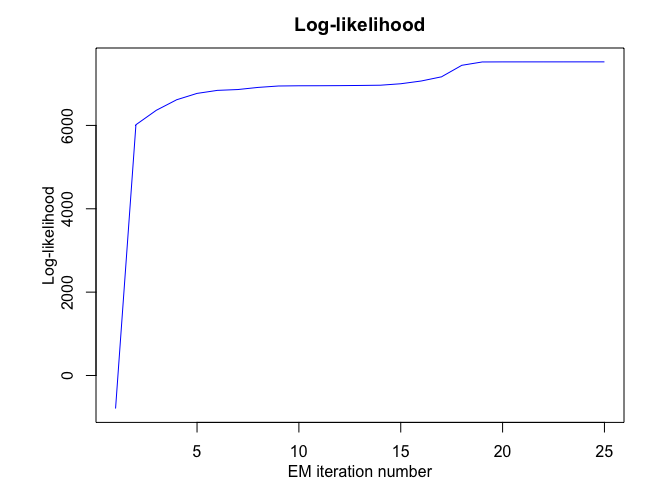
#> EM: Iteration : 1 || log-likelihood : -792.888668727036
#> EM: Iteration : 2 || log-likelihood : 6016.45835957306
#> EM: Iteration : 3 || log-likelihood : 6362.81791662824
#> EM: Iteration : 4 || log-likelihood : 6615.72233403002
#> EM: Iteration : 5 || log-likelihood : 6768.32107943849
#> EM: Iteration : 6 || log-likelihood : 6840.97339565987
#> EM: Iteration : 7 || log-likelihood : 6860.97262839295
#> EM: Iteration : 8 || log-likelihood : 6912.25605673784
#> EM: Iteration : 9 || log-likelihood : 6945.96718258737
#> EM: Iteration : 10 || log-likelihood : 6951.28584396645
#> EM: Iteration : 11 || log-likelihood : 6952.37644678517
#> EM: Iteration : 12 || log-likelihood : 6954.80510338749
#> EM: Iteration : 13 || log-likelihood : 6958.99033092484
#> EM: Iteration : 14 || log-likelihood : 6964.81099837456
#> EM: Iteration : 15 || log-likelihood : 6999.90358068156
#> EM: Iteration : 16 || log-likelihood : 7065.39327246318
#> EM: Iteration : 17 || log-likelihood : 7166.23398344994
#> EM: Iteration : 18 || log-likelihood : 7442.73330846285
#> EM: Iteration : 19 || log-likelihood : 7522.65416438396
#> EM: Iteration : 20 || log-likelihood : 7524.41524338024
#> EM: Iteration : 21 || log-likelihood : 7524.57590110924
#> EM: Iteration : 22 || log-likelihood : 7524.73808801417
#> EM: Iteration : 23 || log-likelihood : 7524.88684996651
#> EM: Iteration : 24 || log-likelihood : 7524.9753964817
#> EM: Iteration : 25 || log-likelihood : 7524.97701548847

mrhlp$summary()
#> ----------------------
#> Fitted MRHLP model
#> ----------------------
#>
#> MRHLP model with K = 5 regimes
#>
#>  log-likelihood nu      AIC      BIC      ICL
#>        7524.977 98 7426.977 7146.696 7147.535
#>
#> Clustering table:
#>   1   2   3   4   5
#> 413 344 588 423 485
#>
#>
#> ------------------
#> Regime 1 (K = 1):
#>
#> Regression coefficients:
#>
#>     Beta(d = 1) Beta(d = 2) Beta(d = 3)
#> 1    1.64847721  2.33823068  9.40173242
#> X^1 -0.31396583  0.38235782 -0.10031616
#> X^2  0.23954454 -0.30105177  0.07812145
#> X^3 -0.04725267  0.06166899 -0.01586579
#>
#> Covariance matrix:
#>
#>   0.0200740364 -0.004238036  0.0004011388
#>  -0.0042380363  0.006082904 -0.0012973026
#>   0.0004011388 -0.001297303  0.0013201963
#> ------------------
#> Regime 2 (K = 2):
#>
#> Regression coefficients:
#>
#>      Beta(d = 1) Beta(d = 2)  Beta(d = 3)
#> 1   -106.0250571 -31.4671946 -107.9697464
#> X^1   45.2035210  21.2126134   72.0220177
#> X^2   -5.7330338  -4.1285514  -13.9857795
#> X^3    0.2343552   0.2485377    0.8374817
#>
#> Covariance matrix:
#>
#>   0.11899225 -0.03866052 -0.06693441
#>  -0.03866052  0.17730401  0.04036629
#>  -0.06693441  0.04036629  0.11983979
#> ------------------
#> Regime 3 (K = 3):
#>
#> Regression coefficients:
#>
#>       Beta(d = 1)  Beta(d = 2)  Beta(d = 3)
#> 1    9.0042249443 -1.247752962 -2.492119515
#> X^1  0.2191555621  0.418071041  0.310449523
#> X^2 -0.0242080660 -0.043802827 -0.039012607
#> X^3  0.0008494208  0.001474635  0.001427627
#>
#> Covariance matrix:
#>
#>   4.103351e-04 -0.0001330363 5.289199e-05
#>  -1.330363e-04  0.0006297205 2.027763e-04
#>   5.289199e-05  0.0002027763 1.374405e-03
#> ------------------
#> Regime 4 (K = 4):
#>
#> Regression coefficients:
#>
#>       Beta(d = 1) Beta(d = 2)  Beta(d = 3)
#> 1   -1029.9071752 334.4975068  466.0981076
#> X^1   199.9531885 -68.7252041 -105.6436899
#> X^2   -12.6550086   4.6489685    7.6555642
#> X^3     0.2626998  -0.1032161   -0.1777453
#>
#> Covariance matrix:
#>
#>   0.058674116 -0.017661572 0.002139975
#>  -0.017661572  0.047588713 0.007867532
#>   0.002139975  0.007867532 0.067150809
#> ------------------
#> Regime 5 (K = 5):
#>
#> Regression coefficients:
#>
#>      Beta(d = 1)   Beta(d = 2)  Beta(d = 3)
#> 1   27.247199195 -14.393798357 19.741283724
#> X^1 -3.530625667   2.282492947 -1.511225702
#> X^2  0.161234880  -0.101613670  0.073003292
#> X^3 -0.002446104   0.001490288 -0.001171127
#>
#> Covariance matrix:
#>
#>   6.900384e-03 -0.001176838  2.966199e-05
#>  -1.176838e-03  0.003596238 -2.395420e-04
#>   2.966199e-05 -0.000239542  5.573451e-04

mrhlp$plot()

MHMMR
# Application to a simulated data set
data("multivtoydataset")

K <- 5 # Number of regimes (states)
p <- 1 # Dimension of beta (order of the polynomial regressors)
variance_type <- "heteroskedastic" # "heteroskedastic" or "homoskedastic" model

n_tries <- 1
max_iter <- 1500
threshold <- 1e-6
verbose <- TRUE

mhmmr <- emMHMMR(multivtoydataset$x, multivtoydataset[, c("y1", "y2", "y3")],
                 K, p, variance_type, n_tries, max_iter, threshold, verbose)
#> EM: Iteration : 1 || log-likelihood : -4539.37845473736
#> EM: Iteration : 2 || log-likelihood : -3075.7862970485
#> EM: Iteration : 3 || log-likelihood : -2904.71126233611
#> EM: Iteration : 4 || log-likelihood : -2883.23456594806
#> EM: Iteration : 5 || log-likelihood : -2883.12446634454
#> EM: Iteration : 6 || log-likelihood : -2883.12436399888

mhmmr$summary()
#> ----------------------
#> Fitted MHMMR model
#> ----------------------
#>
#> MHMMR model with K = 5 regimes
#>
#>  log-likelihood nu       AIC      BIC
#>       -2883.124 84 -2967.124 -3156.43
#>
#> Clustering table:
#>   1   2   3   4   5
#> 100 120 200 100 150
#>
#>
#> ------------------
#> Regime 1 (K = 1):
#>
#> Regression coefficients:
#>
#>     Beta(d = 1) Beta(d = 2) Beta(d = 3)
#> 1    0.11943184   0.6087582   -2.038486
#> X^1 -0.08556857   4.1038126    2.540536
#>
#> Covariance matrix:
#>
#>  1.19064336  0.12765794  0.05537134
#>  0.12765794  0.87145062 -0.05213162
#>  0.05537134 -0.05213162  0.87886166
#> ------------------
#> Regime 2 (K = 2):
#>
#> Regression coefficients:
#>
#>     Beta(d = 1) Beta(d = 2) Beta(d = 3)
#> 1      6.921139   4.9377164   10.290536
#> X^1    1.131946   0.4684922   -1.419758
#>
#> Covariance matrix:
#>
#>   1.0688949 -0.18240787 0.12675972
#>  -0.1824079  1.05317924 0.01419686
#>   0.1267597  0.01419686 0.76030310
#> ------------------
#> Regime 3 (K = 3):
#>
#> Regression coefficients:
#>
#>     Beta(d = 1) Beta(d = 2) Beta(d = 3)
#> 1     3.6576562   6.3642526    8.493765
#> X^1   0.6155173  -0.8844373   -1.137027
#>
#> Covariance matrix:
#>
#>   1.02647251 -0.05491451 -0.01930098
#>  -0.05491451  1.18921808  0.01510035
#>  -0.01930098  0.01510035  1.00352482
#> ------------------
#> Regime 4 (K = 4):
#>
#> Regression coefficients:
#>
#>     Beta(d = 1) Beta(d = 2) Beta(d = 3)
#> 1     -1.439637   -4.463014    2.952470
#> X^1    0.703211    3.649717   -4.187703
#>
#> Covariance matrix:
#>
#>   0.88001190 -0.03249118 -0.03411075
#>  -0.03249118  1.12088583 -0.07881351
#>  -0.03411075 -0.07881351  0.86061127
#> ------------------
#> Regime 5 (K = 5):
#>
#> Regression coefficients:
#>
#>     Beta(d = 1) Beta(d = 2) Beta(d = 3)
#> 1     3.4982408   2.5357751    7.652113
#> X^1   0.0574791  -0.7286824   -3.005802
#>
#> Covariance matrix:
#>
#>  1.13331209 0.25869951 0.03163467
#>  0.25869951 1.21231741 0.04746018
#>  0.03163467 0.04746018 0.80242715

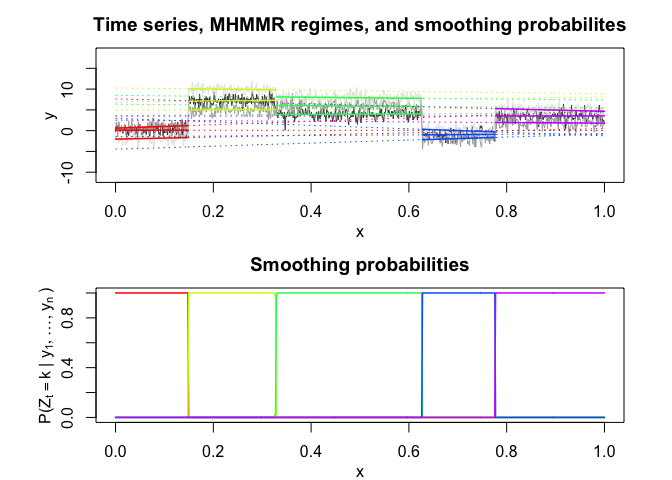
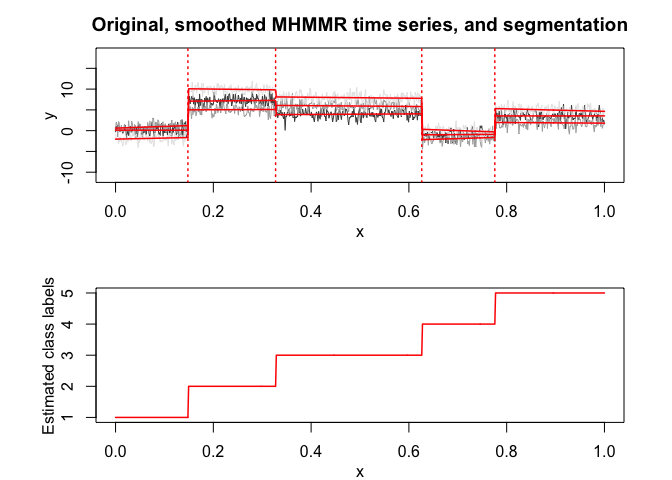
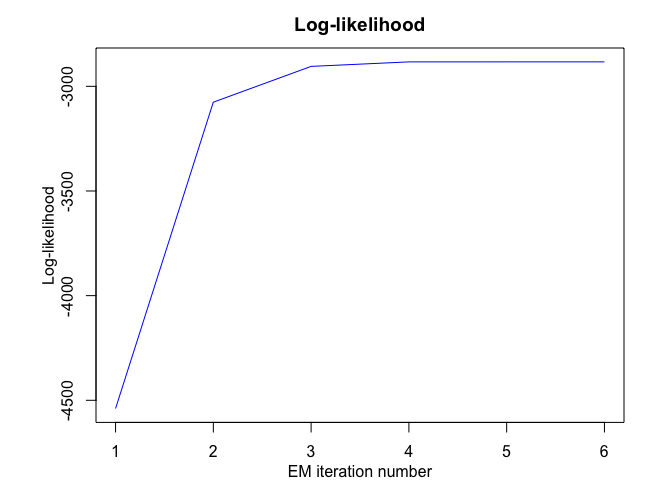
mhmmr$plot(what = c("smoothed", "regressors", "loglikelihood"))
# Application to a real data set (human activity recognition data)
data("multivrealdataset")

K <- 5 # Number of regimes (states)
p <- 3 # Dimension of beta (order of the polynomial regressors)
variance_type <- "heteroskedastic" # "heteroskedastic" or "homoskedastic" model

n_tries <- 1
max_iter <- 1500
threshold <- 1e-6
verbose <- TRUE

mhmmr <- emMHMMR(multivrealdataset$x, multivrealdataset[, c("y1", "y2", "y3")],
                 K, p, variance_type, n_tries, max_iter, threshold, verbose)
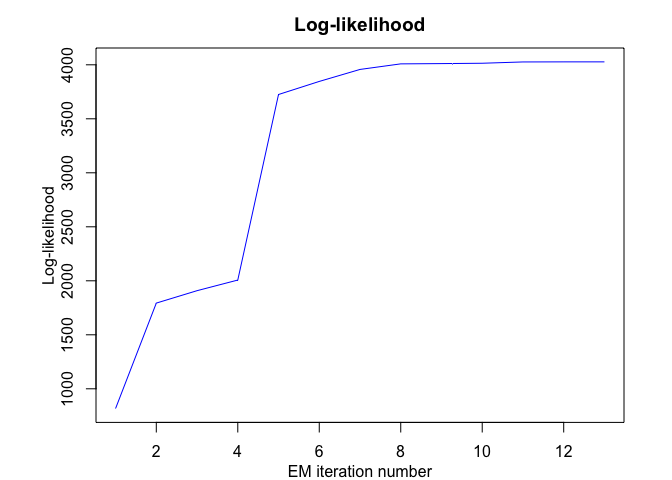
#> EM: Iteration : 1 || log-likelihood : 817.206309249687
#> EM: Iteration : 2 || log-likelihood : 1793.49320726452
#> EM: Iteration : 3 || log-likelihood : 1908.47251424374
#> EM: Iteration : 4 || log-likelihood : 2006.7976746047
#> EM: Iteration : 5 || log-likelihood : 3724.91911814713
#> EM: Iteration : 6 || log-likelihood : 3846.02584774854
#> EM: Iteration : 7 || log-likelihood : 3957.04953794437
#> EM: Iteration : 8 || log-likelihood : 4008.60804596975
#> EM: Iteration : 9 || log-likelihood : 4011.09964067314
#> EM: Iteration : 10 || log-likelihood : 4014.35810165377
#> EM: Iteration : 11 || log-likelihood : 4026.38632031497
#> EM: Iteration : 12 || log-likelihood : 4027.13758668835
#> EM: Iteration : 13 || log-likelihood : 4027.13639613206

mhmmr$summary()
#> ----------------------
#> Fitted MHMMR model
#> ----------------------
#>
#> MHMMR model with K = 5 regimes
#>
#>  log-likelihood  nu      AIC      BIC
#>        4027.136 114 3913.136 3587.095
#>
#> Clustering table:
#>   1   2   3   4   5
#> 461 297 587 423 485
#>
#>
#> ------------------
#> Regime 1 (K = 1):
#>
#> Regression coefficients:
#>
#>     Beta(d = 1) Beta(d = 2)  Beta(d = 3)
#> 1    1.41265303  2.42222746  9.381994682
#> X^1  0.47242692  0.09217574 -0.023282898
#> X^2 -0.28135064 -0.10169173  0.018998710
#> X^3  0.04197568  0.02620151 -0.004217078
#>
#> Covariance matrix:
#>
#>   0.12667921 -0.019381009 -0.018810846
#>  -0.01938101  0.109202105 -0.001402791
#>  -0.01881085 -0.001402791  0.026461790
#> ------------------
#> Regime 2 (K = 2):
#>
#> Regression coefficients:
#>
#>     Beta(d = 1) Beta(d = 2) Beta(d = 3)
#> 1    -3.6868321   2.4724043    7.794639
#> X^1  -6.8471097   4.6786664   14.749215
#> X^2   2.9742521  -1.4716819   -4.646020
#> X^3  -0.2449644   0.1076065    0.335142
#>
#> Covariance matrix:
#>
#>   0.22604244 -0.032716477 0.013626769
#>  -0.03271648  0.032475350 0.008585402
#>   0.01362677  0.008585402 0.041960228
#> ------------------
#> Regime 3 (K = 3):
#>
#> Regression coefficients:
#>
#>      Beta(d = 1)  Beta(d = 2)   Beta(d = 3)
#> 1    0.776245522  0.014437427 -0.1144683124
#> X^1  2.627158141  0.048519275 -0.3883099866
#> X^2 -0.255314738 -0.008318957  0.0283047828
#> X^3  0.008129981  0.000356239 -0.0007003718
#>
#> Covariance matrix:
#>
#>   0.0012000978 -0.0002523608 -0.0001992900
#>  -0.0002523608  0.0006584694  0.0002391577
#>  -0.0001992900  0.0002391577  0.0014228769
#> ------------------
#> Regime 4 (K = 4):
#>
#> Regression coefficients:
#>
#>      Beta(d = 1)   Beta(d = 2)  Beta(d = 3)
#> 1    0.002894474 -0.0002900823 -0.001513232
#> X^1  0.029936273 -0.0029993910 -0.015647636
#> X^2  0.232798943 -0.0233058753 -0.121611904
#> X^3 -0.013209774  0.0019141508  0.009151938
#>
#> Covariance matrix:
#>
#>   0.21455830 -0.07328139 -0.08824736
#>  -0.07328139  0.17055704  0.45218611
#>  -0.08824736  0.45218611  1.76616982
#> ------------------
#> Regime 5 (K = 5):
#>
#> Regression coefficients:
#>
#>       Beta(d = 1)   Beta(d = 2)   Beta(d = 3)
#> 1    9.416685e-05  0.0001347198  0.0005119141
#> X^1  1.259159e-03  0.0018014389  0.0068451694
#> X^2  1.265758e-02  0.0181095390  0.0688126905
#> X^3 -4.344666e-04 -0.0005920827 -0.0022723501
#>
#> Covariance matrix:
#>
#>   0.009259719 -0.000696446 0.006008102
#>  -0.000696446  0.003732296 0.001056145
#>   0.006008102  0.001056145 0.016144263

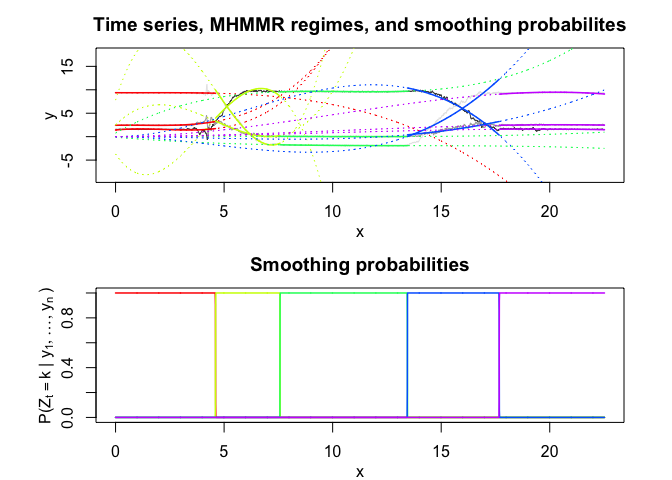
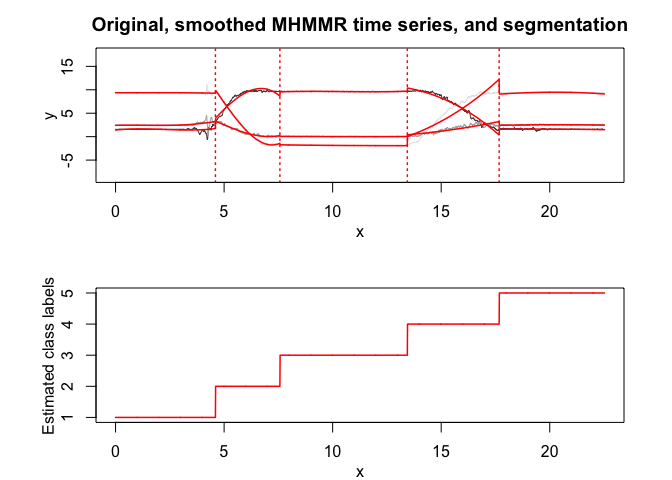
mhmmr$plot(what = c("smoothed", "regressors", "loglikelihood"))
Model selection
In this package, it is possible to select models based on information criteria such as BIC, AIC and ICL.
The selection can be done for the two following parameters:
- K: The number of regimes;
- p: The order of the polynomial regression.
RHLP
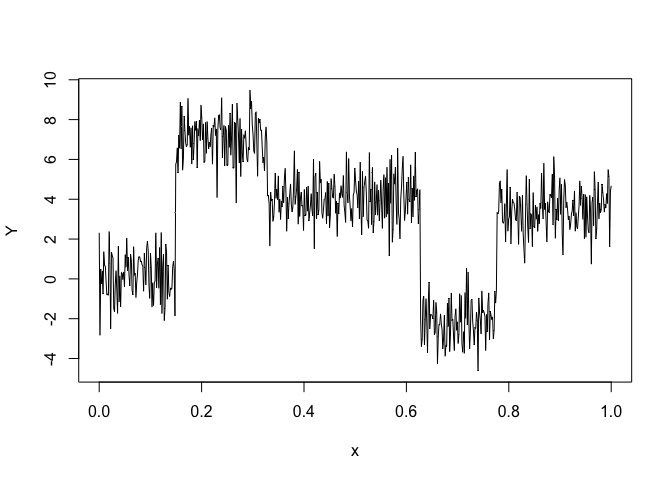
Let’s select a RHLP model for the following time series Y:
data("univtoydataset")
x = univtoydataset$x
y = univtoydataset$y

plot(x, y, type = "l", xlab = "x", ylab = "Y")
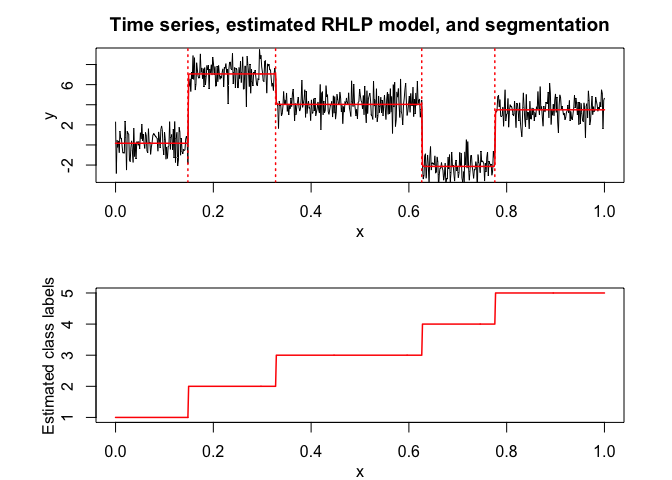
selectedrhlp <- selectRHLP(X = x, Y = y, Kmin = 2, Kmax = 6, pmin = 0, pmax = 3)
#> The RHLP model selected via the "BIC" has K = 5 regimes
#>  and the order of the polynomial regression is p = 0.
#> BIC = -1041.40789532438
#> AIC = -1000.84239591291

selectedrhlp$plot(what = "estimatedsignal")
HMMR
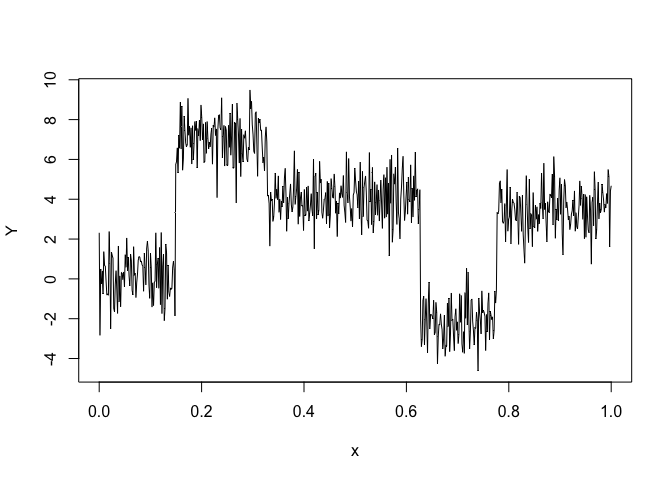
Let’s select a HMMR model for the following time series Y:
data("univtoydataset")
x = univtoydataset$x
y = univtoydataset$y

plot(x, y, type = "l", xlab = "x", ylab = "Y")
selectedhmmr <- selectHMMR(X = x, Y = y, Kmin = 2, Kmax = 6, pmin = 0, pmax = 3)
#> The HMMR model selected via the "BIC" has K = 5 regimes
#>  and the order of the polynomial regression is p = 0.
#> BIC = -1136.39152222095
#> AIC = -1059.76780111041

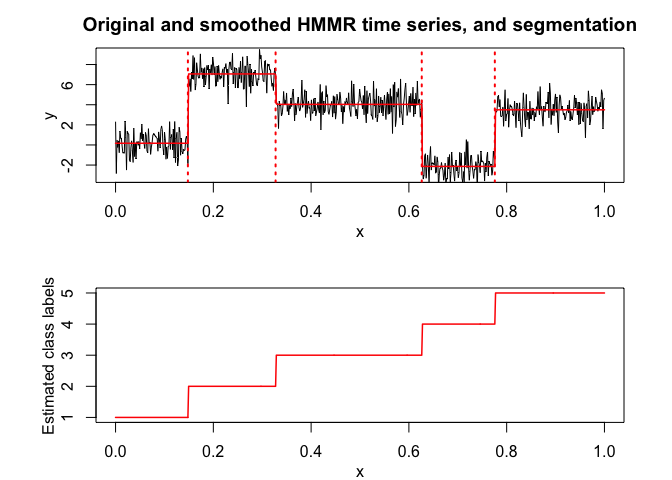
selectedhmmr$plot(what = "smoothed")
MRHLP
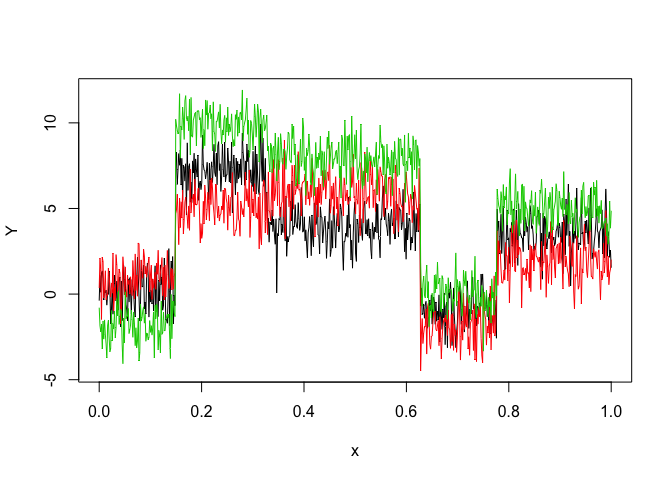
Let’s select a MRHLP model for the following multivariate time series Y:
data("multivtoydataset")
x <- multivtoydataset$x
y <- multivtoydataset[, c("y1", "y2", "y3")]
matplot(x, y, type = "l", xlab = "x", ylab = "Y", lty = 1)
selectedmrhlp <- selectMRHLP(X = x, Y = y, Kmin = 2, Kmax = 6, pmin = 0, pmax = 3)
#> Warning in emMRHLP(X = X1, Y = Y1, K, p): EM log-likelihood is decreasing
#> from -3105.78591044952to -3105.78627830471 !
#> The MRHLP model selected via the "BIC" has K = 5 regimes
#>  and the order of the polynomial regression is p = 0.
#> BIC = -3033.20042397111
#> AIC = -2913.75756459291

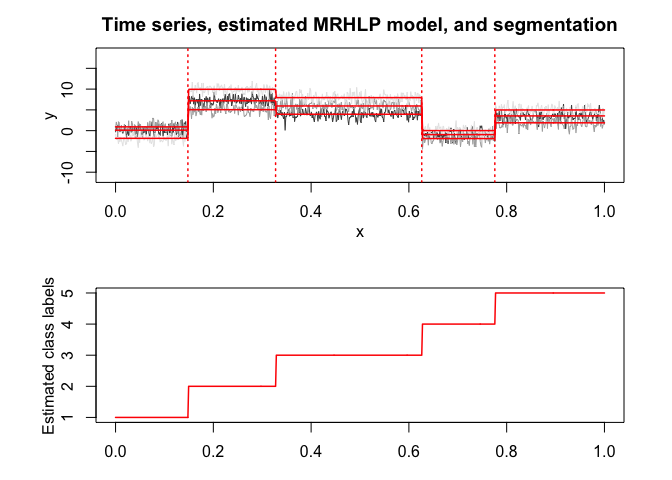
selectedmrhlp$plot(what = "estimatedsignal")
MHMMR
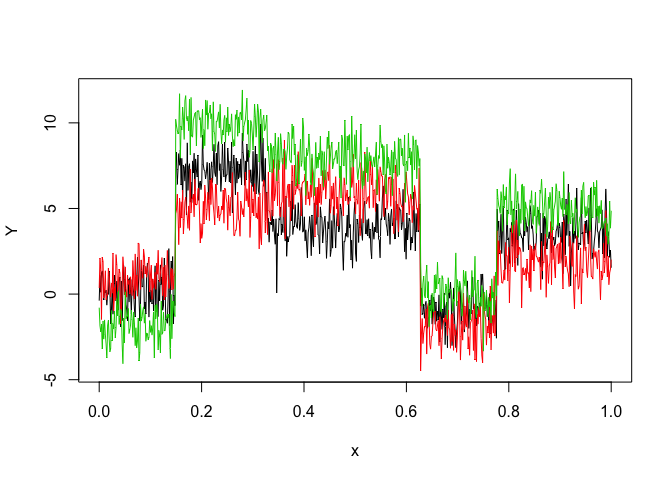
Let’s select a MHMMR model for the following multivariate time series Y:
data("multivtoydataset")
x <- multivtoydataset$x
y <- multivtoydataset[, c("y1", "y2", "y3")]
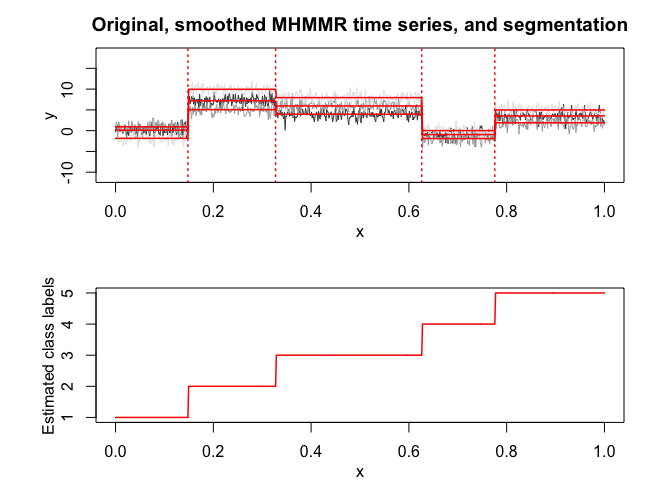
matplot(x, y, type = "l", xlab = "x", ylab = "Y", lty = 1)
selectedmhmmr <- selectMHMMR(X = x, Y = y, Kmin = 2, Kmax = 6, pmin = 0, pmax = 3)
#> The MHMMR model selected via the "BIC" has K = 5 regimes
#>  and the order of the polynomial regression is p = 0.
#> BIC = -3118.9815385353
#> AIC = -2963.48045745801

selectedmhmmr$plot(what = "smoothed")
References
Chamroukhi, Faicel, and Hien D. Nguyen. 2019. “Model-Based Clustering and Classification of Functional Data.” Wiley Interdisciplinary Reviews: Data Mining and Knowledge Discovery. https://chamroukhi.com/papers/MBCC-FDA.pdf.
Chamroukhi, F. 2015. “Statistical Learning of Latent Data Models for Complex Data Analysis.” Habilitation Thesis (HDR), Université de Toulon. https://chamroukhi.com/Dossier/FChamroukhi-Habilitation.pdf.
Trabelsi, D., S. Mohammed, F. Chamroukhi, L. Oukhellou, and Y. Amirat. 2013. “An Unsupervised Approach for Automatic Activity Recognition Based on Hidden Markov Model Regression.” IEEE Transactions on Automation Science and Engineering 3 (10): 829–335. https://chamroukhi.com/papers/Chamroukhi-MHMMR-IeeeTase.pdf.
Chamroukhi, F., D. Trabelsi, S. Mohammed, L. Oukhellou, and Y. Amirat. 2013. “Joint Segmentation of Multivariate Time Series with Hidden Process Regression for Human Activity Recognition.” Neurocomputing 120: 633–44. https://chamroukhi.com/papers/chamroukhi_et_al_neucomp2013b.pdf.
Chamroukhi, F., A. Samé, G. Govaert, and P. Aknin. 2010. “A Hidden Process Regression Model for Functional Data Description. Application to Curve Discrimination.” Neurocomputing 73 (7-9): 1210–21. https://chamroukhi.com/papers/chamroukhi_neucomp_2010.pdf.
Chamroukhi, F. 2010. “Hidden Process Regression for Curve Modeling, Classification and Tracking.” Ph.D. Thesis, Université de Technologie de Compiègne. https://chamroukhi.com/papers/FChamroukhi-Thesis.pdf.
Chamroukhi, F., A. Samé, G. Govaert, and P. Aknin. 2009. “Time Series Modeling by a Regression Approach Based on a Latent Process.” Neural Networks 22 (5-6): 593–602. https://chamroukhi.com/papers/Chamroukhi_Neural_Networks_2009.pdf.