Description
Working with 'Sapfluxnet' Project Data.
Description
Access, modify, aggregate and plot data from the 'Sapfluxnet' project, the first global database of sap flow measurements.
README.md
sapfluxnetr
sapfluxnetr provides tools for a tidy data analysis for the first global database of sap flow measurements
Examples
You can work with individual sites:
# load packages
library(sapfluxnetr)
library(ggplot2)

# ARG_MAZ example site data
data('ARG_MAZ', package = 'sapfluxnetr')
data('sfn_metadata_ex', package = 'sapfluxnetr')

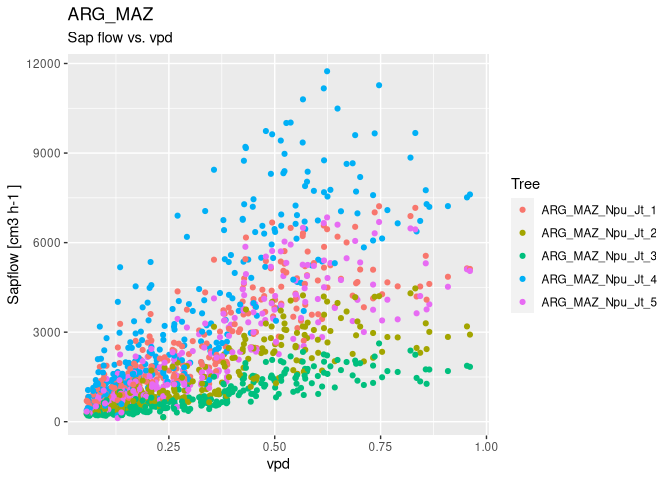
# plot site sapflow measurements versus vpd
sfn_plot(ARG_MAZ, formula_env = ~ vpd)

# daily sapflow and environmental metrics
arg_maz_metrics <- daily_metrics(
  ARG_MAZ, tidy = TRUE, metadata = sfn_metadata_ex
)
#> [1] "Crunching data for ARG_MAZ. In large datasets this could take a while"
#> [1] "General data for ARG_MAZ"

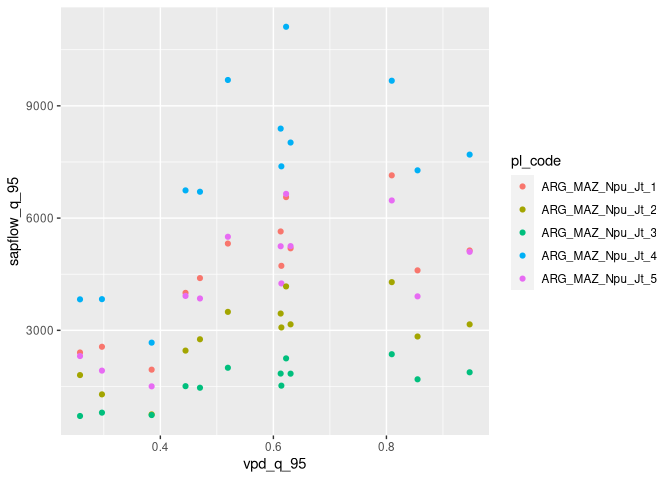
# plot daily aggregations
ggplot(arg_maz_metrics, aes(x = vpd_q_95, y = sapflow_q_95, colour = pl_code)) +
  geom_point()

You can work with multiple sites also:
# ARG_TRE and AUS_CAN_ST2_MIX example sites
data('ARG_TRE', package = 'sapfluxnetr')
data('AUS_CAN_ST2_MIX', package = 'sapfluxnetr')
multi_sfn <- sfn_data_multi(ARG_TRE, ARG_MAZ, AUS_CAN_ST2_MIX)

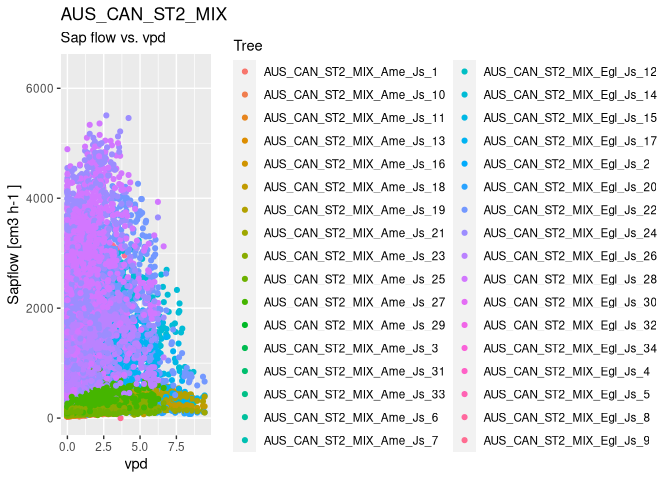
# plotting the individual sites. It creates a list of plots
plots_list <- sfn_plot(multi_sfn, formula_env = ~ vpd)
plots_list[['AUS_CAN_ST2_MIX']]
#> Warning: Removed 526066 rows containing missing values or values outside the scale range
#> (`geom_point()`).

# daily sapflow standard metrics
multi_metrics <- daily_metrics(
  multi_sfn, tidy = TRUE, metadata = sfn_metadata_ex
)
#> [1] "Crunching data for ARG_TRE. In large datasets this could take a while"
#> [1] "General data for ARG_TRE"
#> [1] "Crunching data for ARG_MAZ. In large datasets this could take a while"
#> [1] "General data for ARG_MAZ"
#> [1] "Crunching data for AUS_CAN_ST2_MIX. In large datasets this could take a while"
#> [1] "General data for AUS_CAN_ST2_MIX"

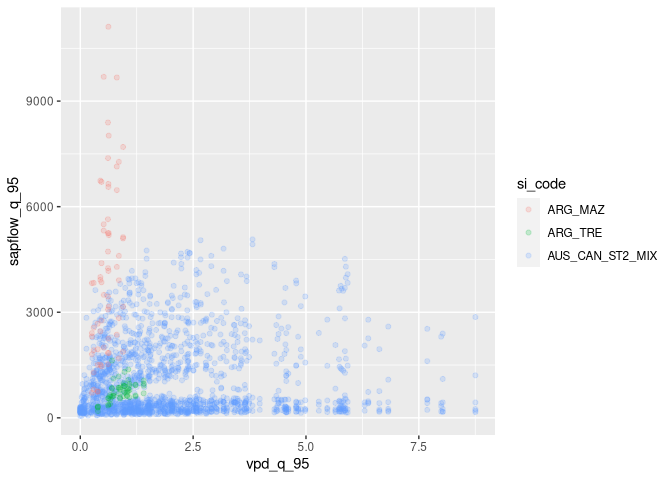
# plot daily aggregations
ggplot(multi_metrics, aes(x = vpd_q_95, y = sapflow_q_95, colour = si_code)) +
  geom_point(alpha = 0.2)
#> Warning: Removed 10966 rows containing missing values or values outside the scale range
#> (`geom_point()`).

Installation
You can install sapfluxnetr from CRAN:
install.packages('sapfluxnetr')
Be advised, sapfluxnetr is in active development and can contain undiscovered bugs. If you find something not working as expected fill a bug at https://github.com/sapfluxnet/sapfluxnetr/issues
Overview
Please see vignette('sapfluxnetr-quick-guide', package = 'sapfluxnetr') for a detailed overview of the package capabilities.