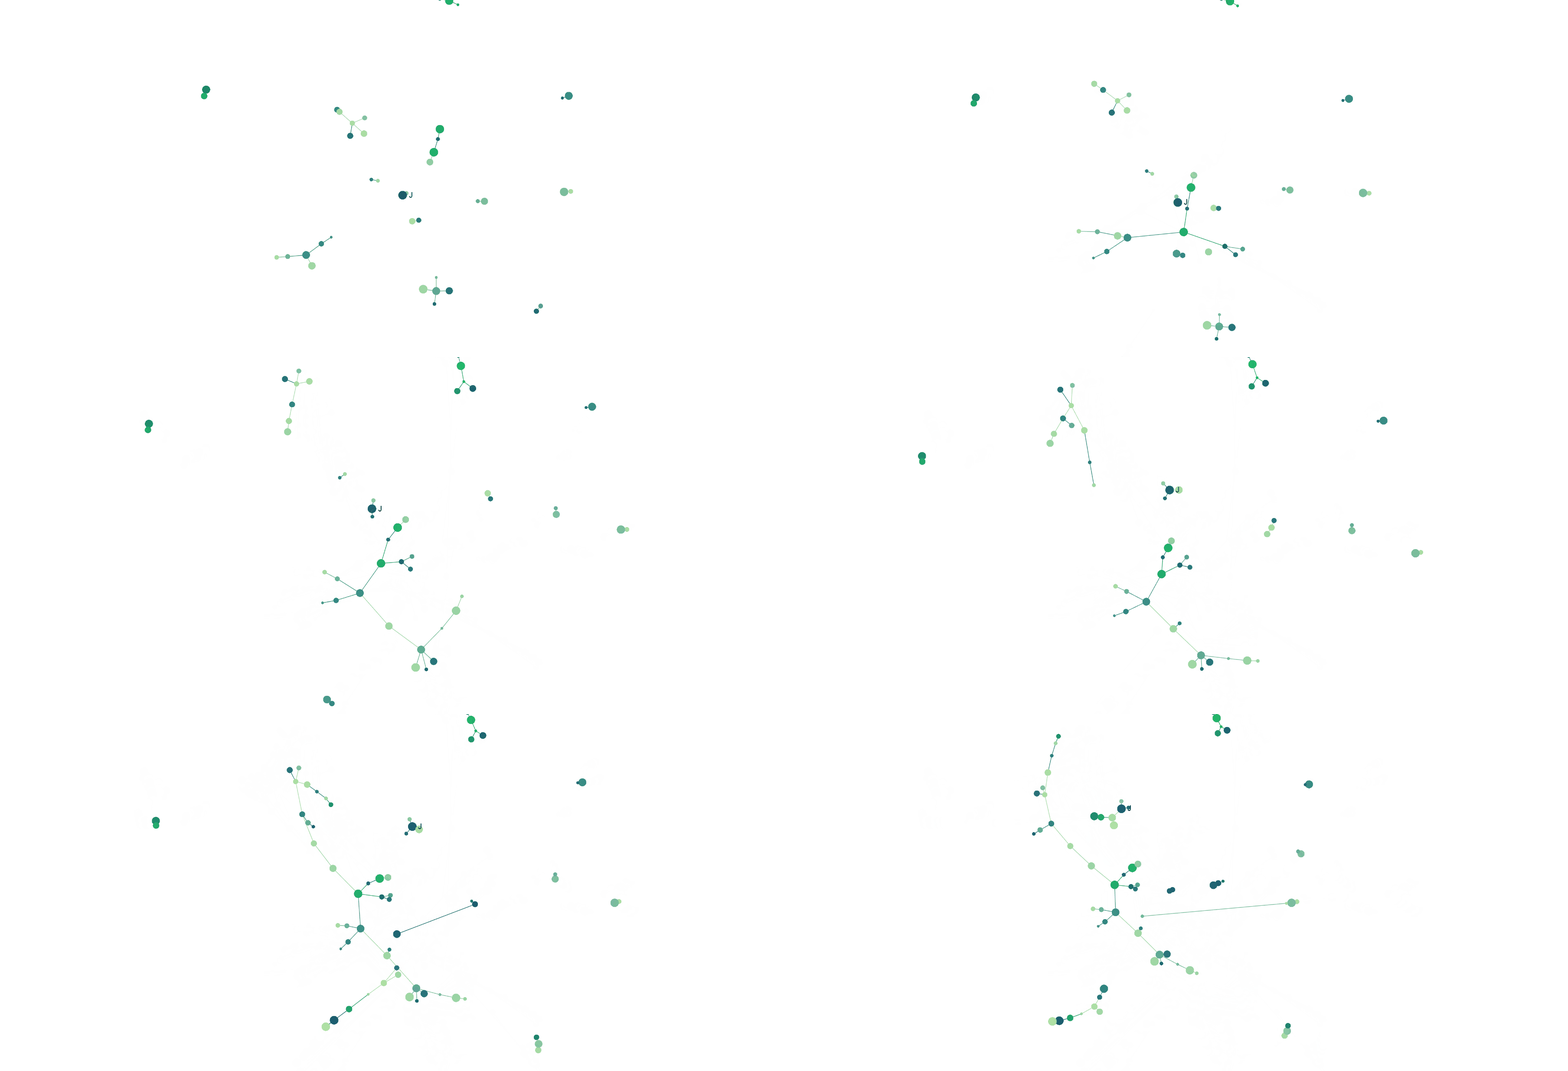
Interface to 'Sigma.js' Graph Visualization Library.
sigmajs

sigmajs for R.
With the rise in popularity of networks, it is important for R users to have access to a package that allows visualising the aforementioned networks in a highly configurable, interactive and dynamic manner. sigmajs is a fully-fledged wrapper for the sigma.js JavaScript library.
The sigma.js JavaScript library is described as follows on its website:
Sigma is a JavaScript library dedicated to graph drawing. It makes easy to publish networks on Web pages, and allows developers to integrate network exploration in rich Web applications
Install
The stable version from CRAN.
install.packages("sigmajs")
The development version from Github of Bitbucket.
# install.packages("devtools")
devtools::install_github("JohnCoene/sigmajs") # github
devtools::install_bitbucket("JohnCoene/sigmajs") # bitbucket
Examples
Most functions have corresponding demo(), see documentation and shiny demo.
library(sigmajs)

# generate data
nodes <- sg_make_nodes()
edges <- sg_make_edges(nodes)

# visualise
sigmajs() %>%
	sg_nodes(nodes, id, label, size, color) %>%
	sg_edges(edges, id, source, target)

# from igraph
data("lesmis_igraph")

layout <- igraph::layout_with_fr(lesmis_igraph)

sigmajs() %>%
	sg_from_igraph(lesmis_igraph, layout)

# from GEXF
gexf <- system.file("examples/arctic.gexf", package = "sigmajs")

sigmajs() %>%
	sg_from_gexf(gexf)

# proxies demos
demo(package = "sigmajs")

Contributing
See the contrinuting guidelines if you encounter any issue. Please note that this project is released with a Contributor Code of Conduct. By participating in this project you agree to abide by its terms.


