Detect Clinical Trial Sites Over- or Under-Reporting Clinical Events.
simaerep 
![]()
![]()
![]()
![]()
Simulate subject-level event reporting of clinical trial sites with the goal of detecting over- and under-reporting.
Monitoring reporting rates of subject-level clinical events (e.g. adverse events, protocol deviations) reported by clinical trial sites is an important aspect of risk-based quality monitoring strategy. Sites that are under-reporting or over-reporting events can be detected using bootstrap simulations during which patients are redistributed between sites. Site-specific distributions of event reporting rates are generated that are used to assign probabilities to the observed reporting rates.
The method is inspired by the ‘infer’ R package and Allen Downey’s blog article: “There is only one test!”.
Installation
CRAN
install.packages("simaerep")
Development Version
You can install the development version from GitHub with:
# install.packages("devtools")
devtools::install_github("openpharma/simaerep")
IMPALA
simaerep has been published as workproduct of the Inter-Company Quality Analytics (IMPALA) consortium. IMPALA aims to engage with Health Authorities inspectors on defining guiding principles for the use of advanced analytics to complement, enhance and accelerate current QA practices. simaerep has initially been developed at Roche but is currently evaluated by other companies across the industry to complement their quality assurance activities (see testimonials).
![]()
Publications
Koneswarakantha, B., Adyanthaya, R., Emerson, J. et al. An Open-Source R Package for Detection of Adverse Events Under-Reporting in Clinical Trials: Implementation and Validation by the IMPALA (Inter coMPany quALity Analytics) Consortium. Ther Innov Regul Sci 58, 591–599 (2024). https://doi.org/10.1007/s43441-024-00631-8
Koneswarakantha, B., Barmaz, Y., Ménard, T. et al. Follow-up on the Use of Advanced Analytics for Clinical Quality Assurance: Bootstrap Resampling to Enhance Detection of Adverse Event Under-Reporting. Drug Saf (2020). https://doi.org/10.1007/s40264-020-01011-5
Resources
- Slides PHUSE conference
- Article PHUSE conference
- video presentation 15 min
- Documentation with Vignettes
Validation Report
Download as pdf in the release section generated using thevalidatoR.
{gsm.simaerep}
We have created an extension gsm.simaerep so that simaerep event reporting probabilities can be added to good statistical monitoring gsm.core reports.
Application
Calculate patient-level event reporting probabilities and the difference to the expected number of events on a simulated data set with 2 under-reporting sites.
suppressPackageStartupMessages(library(simaerep))
suppressPackageStartupMessages(library(dplyr))
suppressPackageStartupMessages(library(knitr))

set.seed(1)

df_visit <- sim_test_data_study(
  n_pat = 1000, # number of patients in study
  n_sites = 100, # number of sites in study
  ratio_out = 0.02, # ratio of sites with outlier
  factor_event_rate = -0.5, # rate of under-reporting
  # non-constant event rates based on gamma distribution
  event_rates = (dgamma(seq(1, 20, 0.5), shape = 5, rate = 2) * 5) + 0.1,
  max_visit = 20,
  max_visit_sd = 10,
  study_id = "A"
)

df_visit %>%
  select(study_id, site_id, patient_id, visit, n_event) %>%
  head(25) %>%
  knitr::kable()
| study_id | site_id | patient_id | visit | n_event |
|---|---|---|---|---|
| A | S0001 | P000001 | 1 | 0 |
| A | S0001 | P000001 | 2 | 2 |
| A | S0001 | P000001 | 3 | 2 |
| A | S0001 | P000001 | 4 | 4 |
| A | S0001 | P000001 | 5 | 6 |
| A | S0001 | P000001 | 6 | 7 |
| A | S0001 | P000001 | 7 | 7 |
| A | S0001 | P000001 | 8 | 7 |
| A | S0001 | P000001 | 9 | 7 |
| A | S0001 | P000001 | 10 | 7 |
| A | S0001 | P000001 | 11 | 7 |
| A | S0001 | P000001 | 12 | 7 |
| A | S0001 | P000001 | 13 | 7 |
| A | S0001 | P000002 | 1 | 3 |
| A | S0001 | P000002 | 2 | 3 |
| A | S0001 | P000002 | 3 | 5 |
| A | S0001 | P000002 | 4 | 8 |
| A | S0001 | P000002 | 5 | 8 |
| A | S0001 | P000002 | 6 | 9 |
| A | S0001 | P000002 | 7 | 9 |
| A | S0001 | P000002 | 8 | 9 |
| A | S0001 | P000002 | 9 | 9 |
| A | S0001 | P000002 | 10 | 9 |
| A | S0001 | P000002 | 11 | 9 |
| A | S0001 | P000002 | 12 | 9 |
evrep <- simaerep(df_visit, mult_corr = TRUE)

plot(evrep, study = "A")
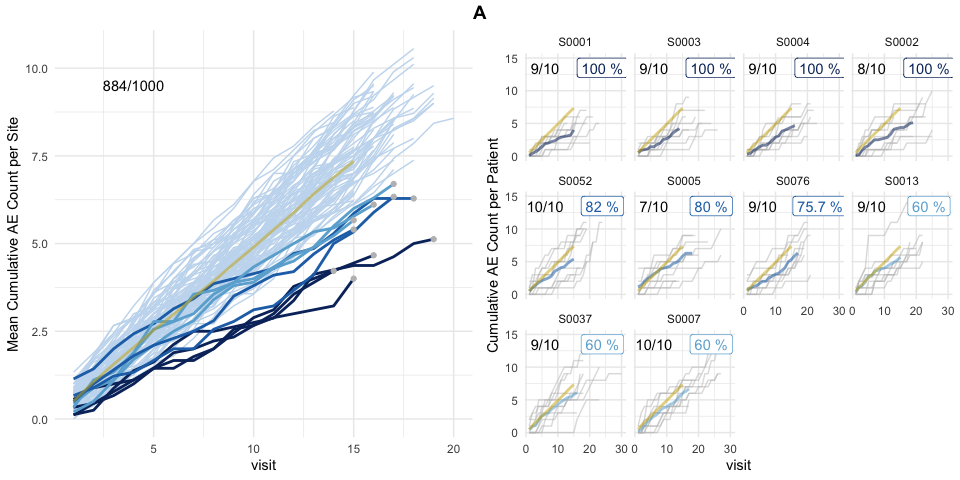
Left panel shows mean cumulative event reporting per site (blue lines) against mean cumulative event reporting of the entire study (golden line). Sites with either high under-reporting (negative probabilities) or high over-reporting (positive probabilities) are marked by grey dots and plotted in additional panels on the right. N denotes the number of sites. Right panel shows individual sites with total patient cumulative counts as grey lines. N denotes the number of patients, the percentage the under- and over-reporting probability and delta denotes the difference compared to the expected number of events.
In Database Calculation
The inframe algorithm uses only dbplyr compatible table operations and can be executed within a database backend as we demonstrate here using duckdb.
However, we need to provide a in database table that has as many rows as the desired replications in our simulation, instead of providing an integer for the r parameter.
con <- DBI::dbConnect(duckdb::duckdb(), dbdir = ":memory:")
df_r <- tibble(rep = seq(1, 1000))
dplyr::copy_to(con, df_visit, "visit")
dplyr::copy_to(con, df_r, "r")
tbl_visit <- tbl(con, "visit")
tbl_r <- tbl(con, "r")
evrep <- simaerep(
tbl_visit,
r = tbl_r
)
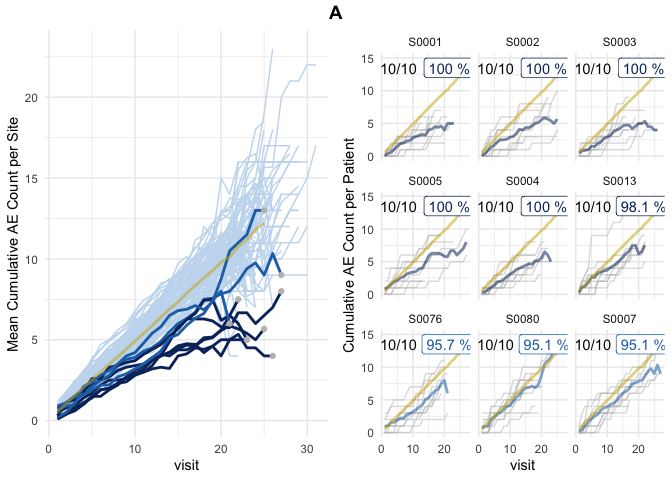
plot(evrep, study = "A")
DBI::dbDisconnect(con)