Description
Detect Anomalies Using the Spectral Residual Algorithm.
Description
Apply the spectral residual algorithm to data, such as a time series, to detect anomalies. Anomaly scores can be used to determine outliers based upon a threshold or fed into more sophisticated prediction models. Methods are based upon "Time-Series Anomaly Detection Service at Microsoft", Ren, H., Xu, B., Wang, Y., et al., (2019) <doi:10.48550/arXiv.1906.03821>.
README.md
spectralAnomaly 

![]()
![]()
The {spectralAnomaly} package is a simple set of tools for R users to detect anomalies in data, such as a time series, using the ‘Spectral Residual’ method.
Installation
The {spectralAnomaly} can be installed directly from CRAN:
install.packages('spectralAnomaly')
You can also install the latest development version of {spectralAnomaly} like so:
remotes::install_github('al-obrien/spectralAnomaly')
Examples
library(spectralAnomaly)
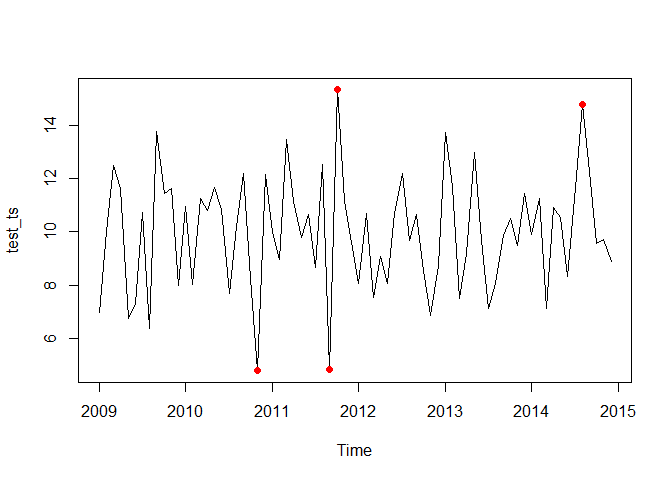
Create a noisy time series with a modest anomaly threshold
test_ts <- ts(rnorm(12*6,10,2), start=c(2009, 1), end=c(2014, 12), frequency=12)
ts_scores <- anomaly_score(test_ts, score_window = 25)
plot(test_ts, type = 'l')
points(test_ts, col = ifelse(ts_scores > quantile(ts_scores, prob = 0.95),'red',NA), pch = 16)
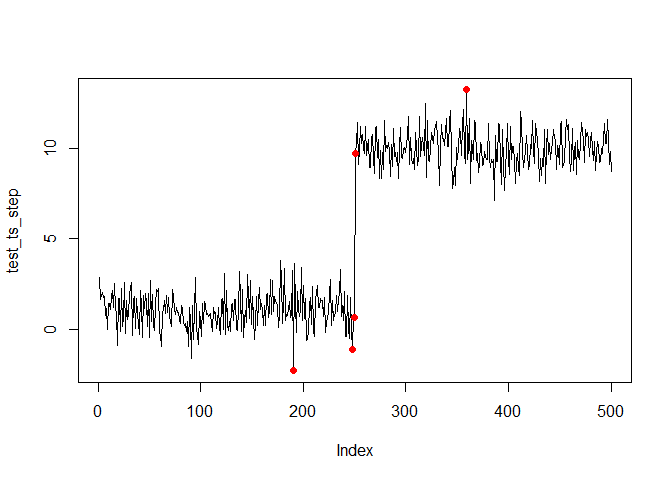
Create a series with a step
test_ts_step <- c(rnorm(1, 1, n=250),
                  rnorm(10, 1, n=250))
ts_scores <- anomaly_score(test_ts_step, score_window = 100)
plot(test_ts_step, type = 'l')
points(test_ts_step, col = ifelse(ts_scores > quantile(ts_scores, prob = 0.99),'red',NA), pch = 16)