Description
Create Publication Ready Kaplan-Meier Plots.
Description
Incorporate various statistics and layout customization options to enhance the efficiency and adaptability of the Kaplan-Meier plots.
README.md
survSAKK 
Overview
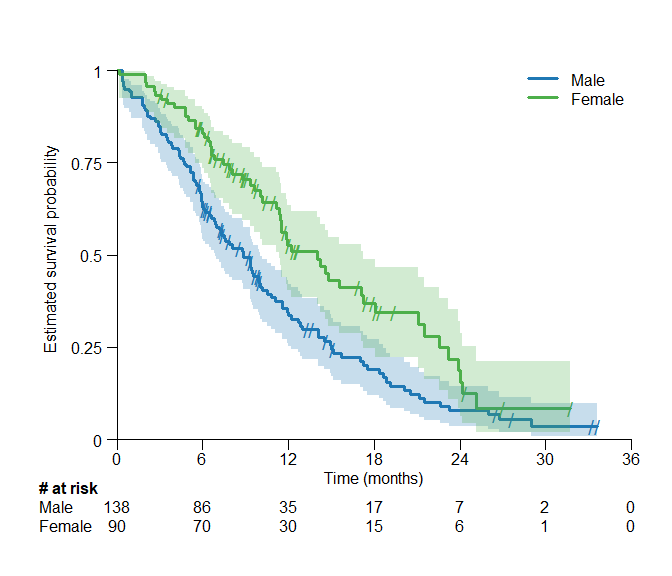
The survSAKK R package provides the surv.plot() function, facilitating Kaplan-Meier survival analysis. Designed with user-friendliness and efficiency in mind. Offering a robust tool for analysing survival data. It utilises the functionalites of survival::survfit().
Installation
Install the current version of survSAKK with:
# install.packages("devtools")
devtools::install_github("SAKK-Statistics/survSAKK",
                         build_vignettes = TRUE,
                         force = TRUE)
Usage
# Load required library
library(survSAKK)
library(survival)

# Fit survival object
fit <- survfit(Surv(lung$time/365.25*12, status) ~ sex, data = lung)

# Generate surival plot
surv.plot(fit = fit,
          time.unit = "month",
          legend.name =  c("Male", "Female"))
Getting help
Documentation
# R Documentation
## survSAKK: Create publication ready Kaplan-Meier plot
help("survSAKK-package")

## Publication Ready Kaplan-Meier Plot
help("surv.plot")
Vignette
Webpage of the vignette: survSAKK
# Vignette
vignette("surv.plot", package = "survSAKK")
![]()
![]()